Is AI adoption stalling? A two-speed diffusion seen through the data
The most accurate way to characterise the current general AI moment is not stall but divergence. At the infrastructure layer, adoption is accelerating sharply. Alphabet just lifted its 2025 capital-expenditure guidance to 85 billion US dollars, explicitly to fund AI data centres and servers. Microsoft is committing roughly 80 billion US dollars to AI and cloud infrastructure this fiscal year, even as it trims headcount. Amazon is signalling capex above 100 billion US dollars for 2025, and Meta guides 64 to 72 billion US dollars. S&P Global Market Intelligence estimates the five largest hyperscalers will together spend more than 1 trillion US dollars between 2024 and 2027, largely on AI infrastructure. Goldman Sachs similarly frames a trillion-dollar capex wave with little immediate revenue to show for it. These are not the numbers of a stall. They are the numbers of an installation phase that precedes widespread deployment.

The installation phase is unmistakable. Aggregate capex across Alphabet, Microsoft, Amazon and Meta rises from roughly US$90bn in 2020 to ~US$355bn guided for 2025.
The 2025 numbers are management guidance/analyst estimates: Alphabet US$85bn (raised from 75), Microsoft ~US$80bn, Amazon >US$100bn (we use 100 as a proxy), Meta US$64–72bn (midpoint used).
This confirms the divergence: infrastructure spend is accelerating even as enterprise monetisation lags.
A layer up, to enterprise software and business processes, and the picture changes. McKinsey’s May 2024 survey finds 65 percent of firms say they are regularly using generative AI, almost double the figure ten months earlier, but Boston Consulting Group reports that 74 percent still struggle to achieve and scale value. UBS tells clients that overall adoption remains far from a peak and that monetisation will lag capex through 2025. The phrase cognitive dissonance fits: investors remain constructive, but the earnings lines that would normally validate this optimism are still thin.
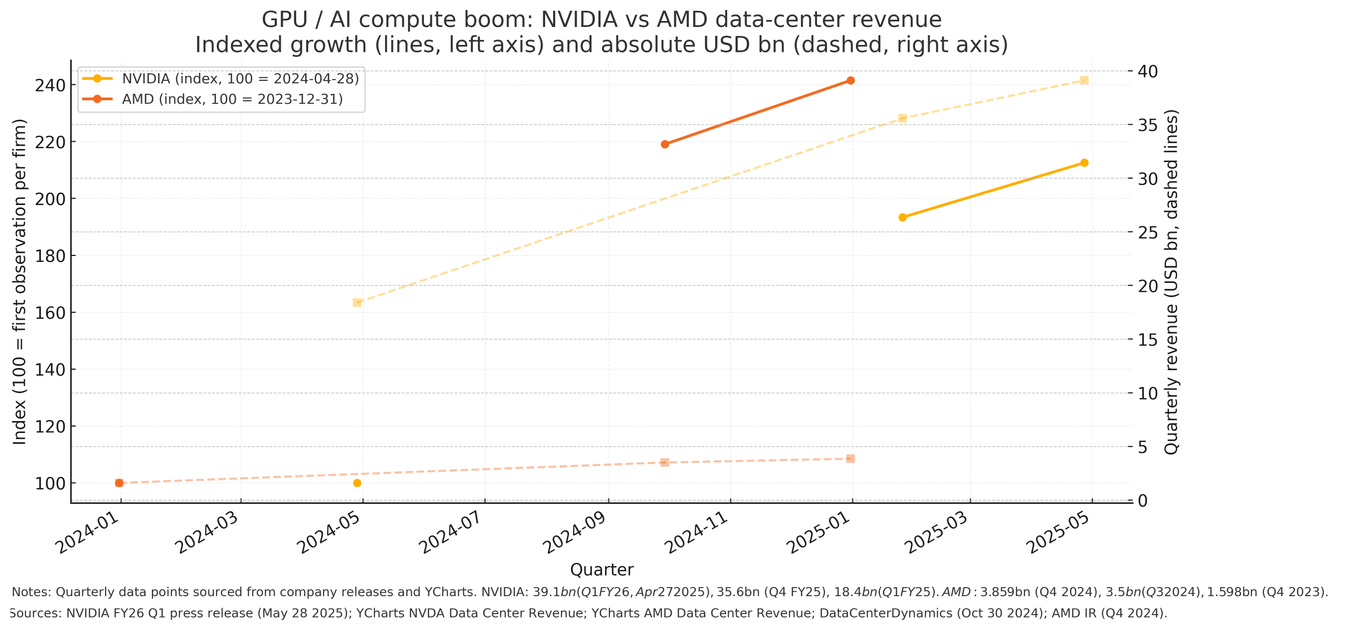
Indexed lines (left axis): NVIDIA and AMD each normalised to 100 at their first observation. NVIDIA climbs to ~205 within three quarters. AMD climbs to ~241 over four quarters.
Dashed lines (right axis): the absolute quarterly revenue gap is stark. NVIDIA moves from 18.4bn → 35.6bn → 39.1bn in three quarters. AMD rises from 1.60bn → 3.50bn → 3.86bn. The scale differential is structural even as AMD’s growth rate is high.
Macro data reinforce this two-speed story. The Stanford AI Index documents a surge in private investment, model capability and research output, while economy-wide productivity effects remain hard to detect. IEEE Spectrum’s review of the Index reaches the same conclusion. This is consistent with the historical pattern for general purpose technologies, where diffusion, complementary capital and organisational redesign take time.
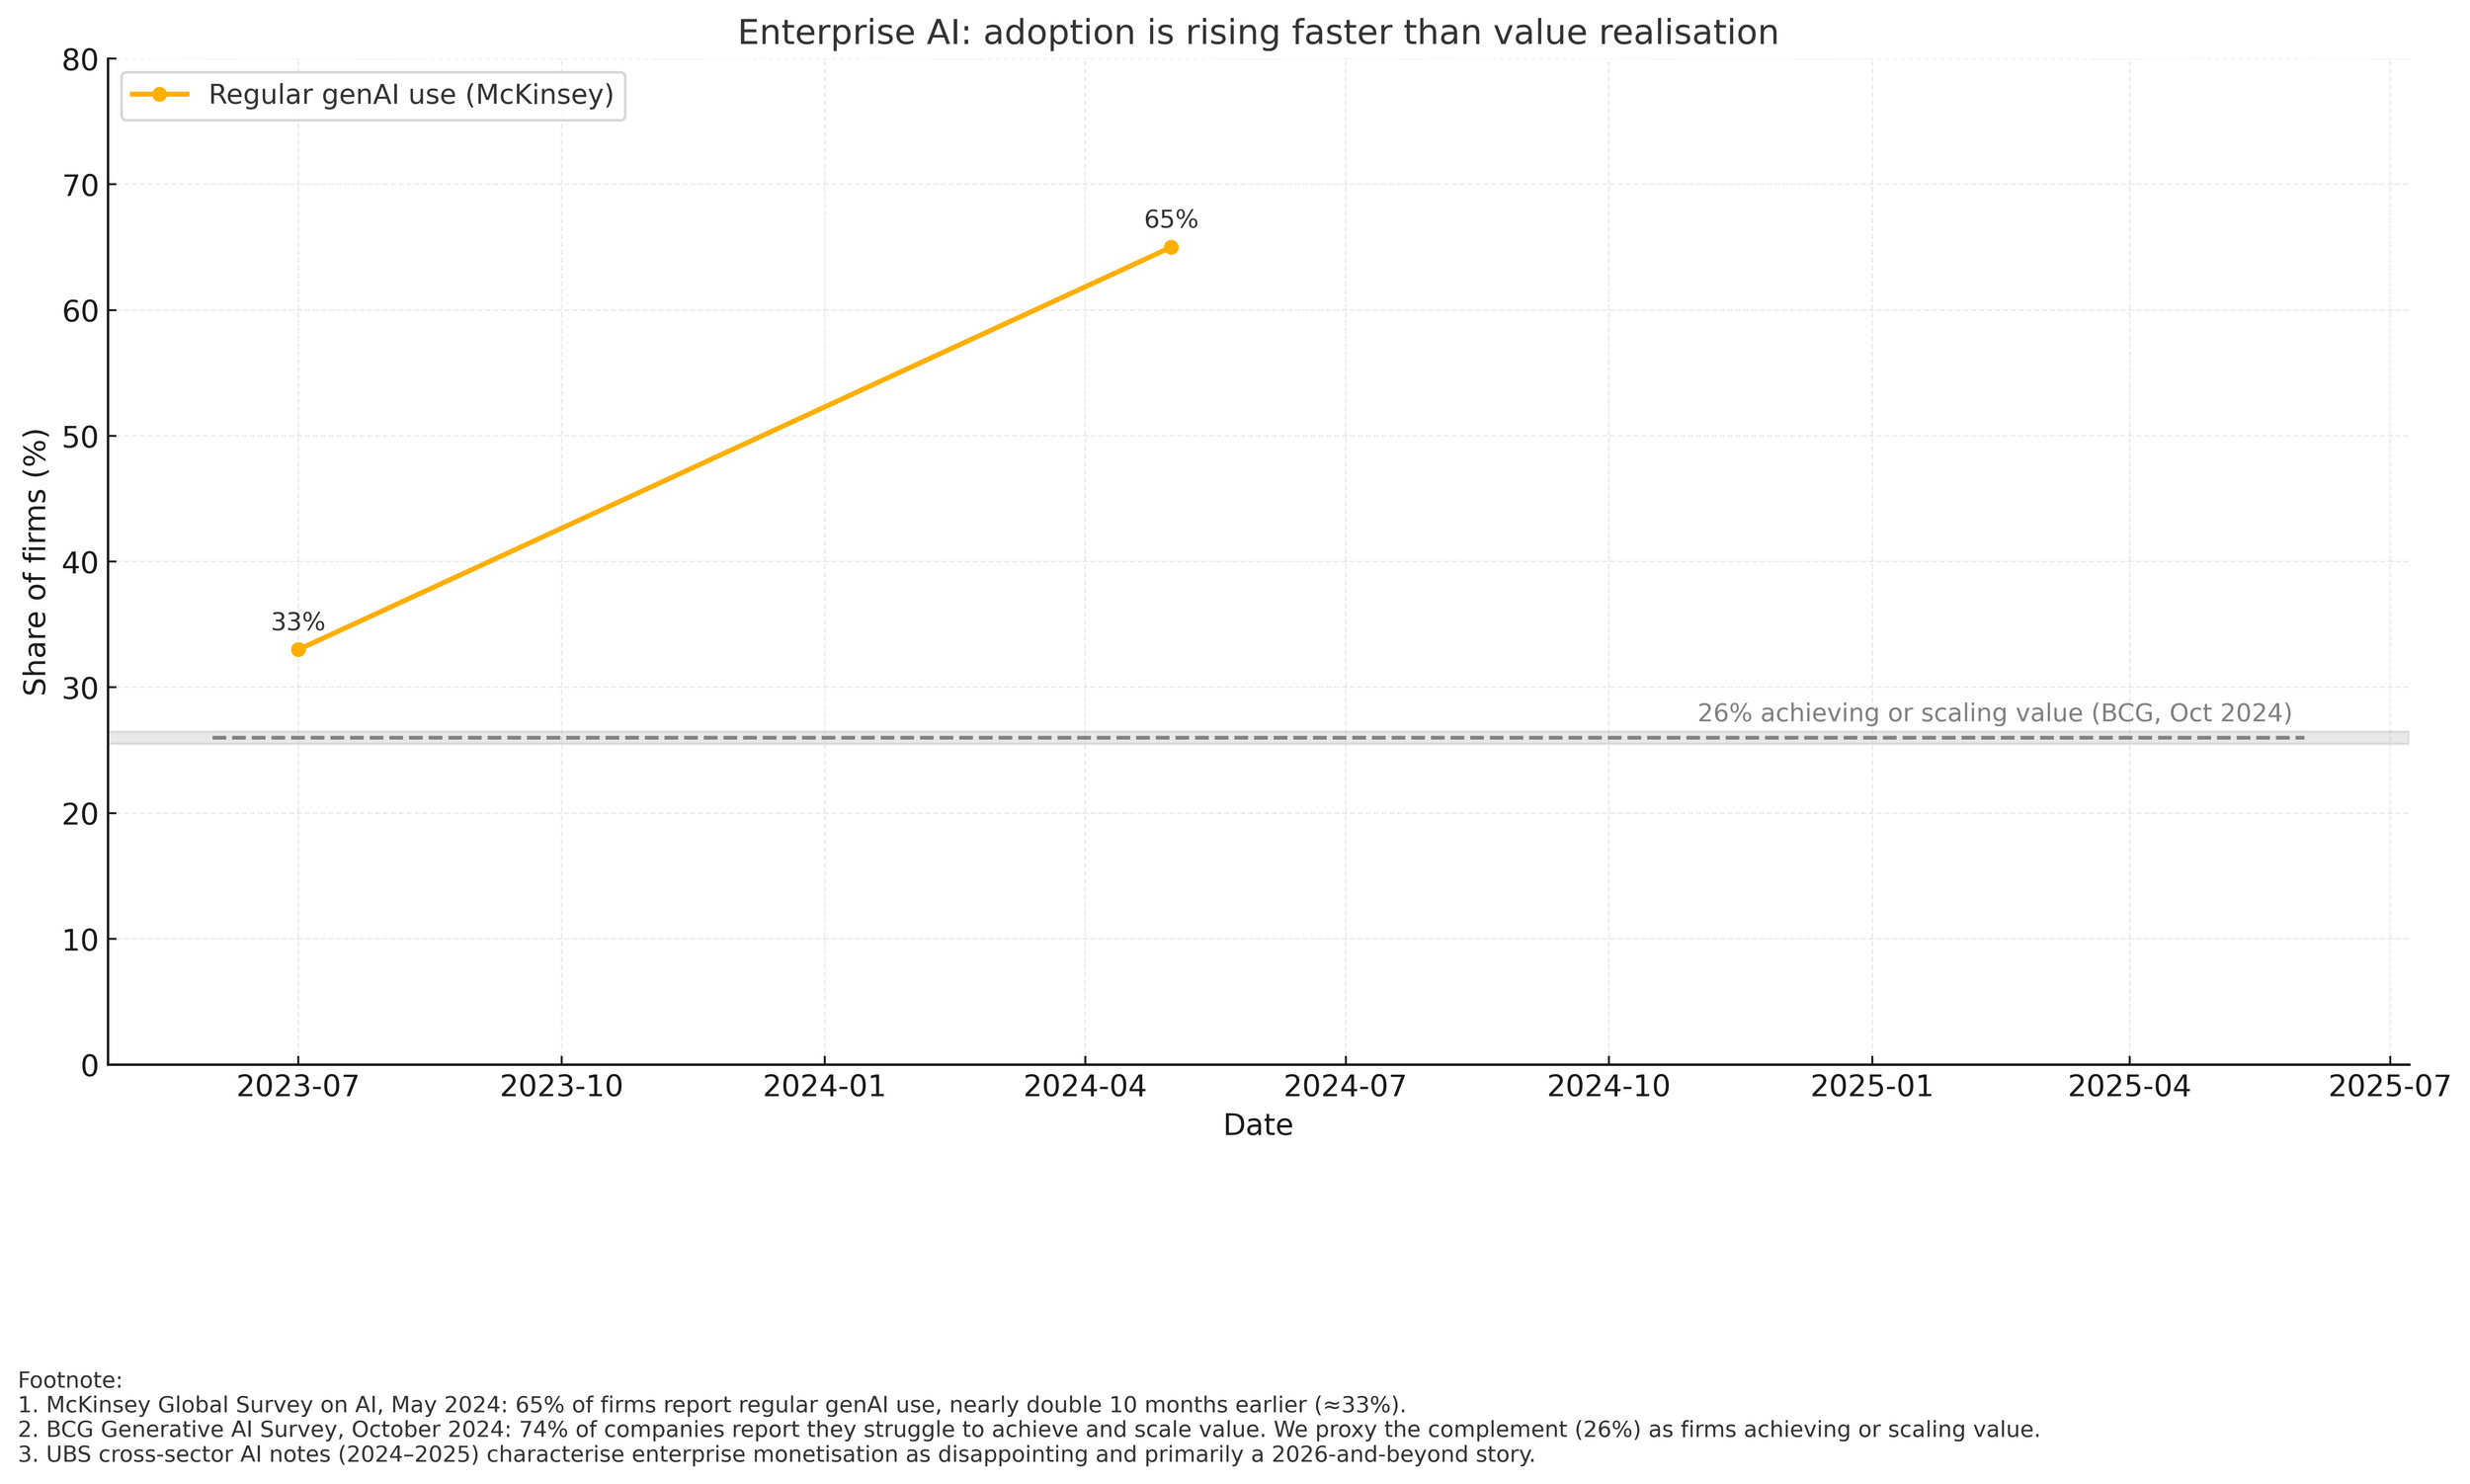
Regular genAI use (McKinsey): 33% in July 2023 to 65 percent in May 2024
At-scale value capture (BCG proxy): 26% (74% report they still struggle to achieve and scale value)
Adoption has almost doubled in under a year, but the share of firms that say they are actually achieving and scaling value remains roughly one quarter. UBS’s analyst language, “disappointing” monetisation and a “2026+ story” is consistent with the flat band in the chart rather than an upward-sloping value line.
Inside firms, four frictions explain why the value curve is flatter than the hype curve. First, integration costs are real. Data quality, workflow redesign, evaluation and governance lift the fixed costs of moving from pilots to production. Second, the unit economics of inference are still in flux, with latency, reliability and guardrail stacks adding ongoing operating expenditure that finance teams cannot yet underwrite confidently. Third, capability does not automatically meet materiality. Many proposed use cases do not clear a 5% to 10% EBIT hurdle once all the peripheral costs are counted, a point that sits between the lines of both the McKinsey and BCG work. Fourth, regulatory and reputational exposure slows deployment in finance, health and government, where auditability and liability allocation are not yet standardised.

Exposure is Felten–Raj–Seamans AIIE, aggregated from 4-digit to 2-digit NAICS using 2019 BLS industry–occupation employment weights. Outcome is BLS industry labour productivity (series __L010000000), 2018–2024, rebased to 2019 = 100. Model is OLS with sector and year fixed effects; standard errors are clustered by sector. Baseline year is 2019. All post-2022 exposure × year coefficients are statistically indistinguishable from zero at the 5% level, indicating no detectable aggregate productivity divergence between high- and low-exposure sectors so far.
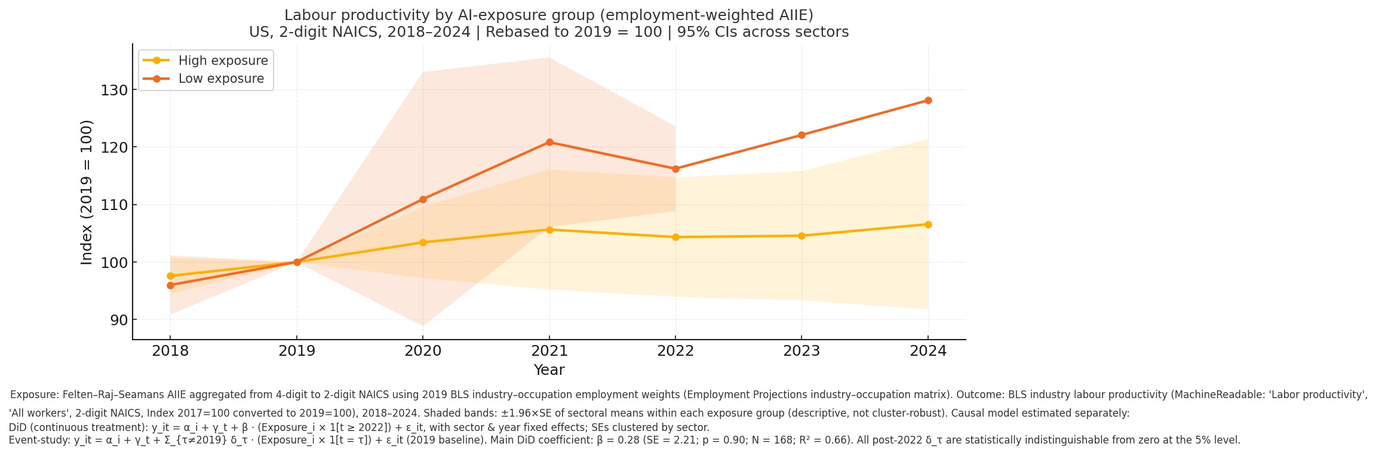
Exposure is Felten–Raj–Seamans AIIE, aggregated from 4-digit to 2-digit NAICS using 2019 BLS industry–occupation employment weights. Outcome is BLS industry labour productivity (MachineReadable tables), rebased to 2019 = 100. Shaded areas are 95% CIs across sectors within each group (descriptive, not cluster-robust). The gap between high- and low-exposure sectors is small and statistically indistinguishable from zero; the corresponding DiD estimate is β = 0.28 (SE = 2.21, p = 0.90).
AI adoption is not stalling. It is unfolding on two distinct clocks. Capital expenditure and compute supply are compounding at rates that rule out a slowdown, yet measurable enterprise value and broad productivity gains are still scarce. The data say the following: hyperscaler capex and GPU revenues are surging; enterprise “use” has doubled but the share of firms that can show scaled EBIT impact is stuck in the mid-20s; and a difference-in-differences test on US sectoral labour productivity, using employment-weighted exposure scores, finds no statistically significant post-2022 lift for the most AI-exposed industries. This is the classic installation phase dynamic. Infrastructure races ahead, while firms work through integration costs, governance, liability, evaluation, and unit-economics uncertainty.
To separate signal from noise, policymakers, investors and executives should watch four tiers of indicators each quarter. First, infrastructure intensity: hyperscaler capex guidance versus realised spend, GPU shipments and implied installed compute, along with megawatts of data-centre capacity under construction. These series are already on steep S-curves. Second, developer tool usage: growth in coding-assistant seats, token consumption on foundation model APIs and the acceptance rate of suggested code. These show capability diffusion but not necessarily economic value. Third, enterprise productionisation: the share of large firms reporting more than 5 percent EBIT contribution from AI, the proportion of models with signed off model-risk governance and the incremental ARPU that SaaS vendors can attribute to AI features. This is where the bottleneck lives. Fourth, macro outcomes: the productivity differential between AI-exposed and less exposed occupations, and wage dispersion across those cohorts. This is the slowest to move and will only inflect once the third tier scales.
The monetisation curve will steepen once three conditions are met. First, inference costs must fall by another order of magnitude so that CFOs can underwrite persistent margin gains rather than pilot savings. Second, evaluation, audit, and guardrail stacks must standardise so that legal and reputational risk are priced, contracted, and insurable. Third, firms must refactor workflows and data pipelines deeply enough that AI augments or replaces whole processes, not single tasks. Until then, value will remain concentrated among the sellers of compute, the owners of scarce models, and the few enterprises that have already rebuilt their production and risk stacks around AI.
-
Hyperscaler capex, infra spend and company guidance
Alphabet Inc. (2025) Q1 2025 earnings call / guidance transcript — raised 2025 capex guidance to c. US$85bn.
Alphabet Inc. (2024) Form 10-K (FY2024).
Amazon.com, Inc. (2025) Management guidance and earnings commentary indicating >US$100bn capex for 2025.
Amazon.com, Inc. (2024) Form 10-K (FY2024).
Meta Platforms, Inc. (2024) Form 10-K (FY2024).
Meta Platforms, Inc. (2025) FY2025 capex guidance (US$64–72bn) in earnings call / investor presentation.
Microsoft Corporation (2024) Form 10-K (FY2024).
Microsoft Corporation (2025) FY2025 guidance and earnings call commentary indicating ~US$80bn AI/cloud capex.
Goldman Sachs (2024) The AI spending boom: quantifying the coming capex wave. Research note.
S&P Global Market Intelligence (2024) Hyperscalers to spend over US$1tn on data centres, 2024–2027. Research note.
GPU / compute revenue concentration
NVIDIA Corporation (2025) Q1 FY2026 earnings press release and presentation (data-centre revenue US$39.1bn).
YCharts (2025) NVIDIA: Data Center Revenue (quarterly series).
Advanced Micro Devices, Inc. (2024) Q3 & Q4 2024 earnings materials (data-centre revenue US$3.5bn and US$3.86bn).
DataCenterDynamics (2024) ‘AMD data-center revenue jumps on MI300 demand’, 30 October.
YCharts (2025) AMD: Data Center Revenue (quarterly series).
Adoption vs value realisation (surveys / analyst notes)
McKinsey & Company (2024) The State of AI in 2024: GenAI adoption grows and begins to generate value (May).
Boston Consulting Group (2024) Mind the Gap: Why 74% of companies struggle to scale GenAI value (October).
UBS (2024–2025) Global AI adoption / software monetisation series — multiple sector notes describing monetisation as “disappointing” and largely a 2026+ story.
Macro/productivity & exposure literature
Stanford Institute for Human-Centered AI (2024) AI Index Report 2024.
IEEE Spectrum (2024) ‘AI Index 2024 shows soaring model capability, elusive productivity’.
International Monetary Fund (2024) GenAI and the Macroeconomy (various authors; Staff Discussion Notes / Working Papers series).
International Monetary Fund (2024) WP/24/199 — (firm or regional) AI adoption and labour-market outcomes (shift-share specification).
Pizzinelli, C., Tavares, M. M., and co-authors (2023/2024) Labour Market Exposure to AI: Cross-country Differences and the Role of Structural Factors. IMF Working Paper / associated SDN 2024/001.
Felten, E., Raj, M., and Seamans, R. (2021, 2023, 2024) Characterizing AI Occupation Exposure and AIOE / AIIE Datasets (GitHub data appendix, incl. AIOE_DataAppendix.xlsx).
Data used in the DiD / event-study
US Bureau of Labor Statistics (2024) Industry Productivity and Costs — flat files (ip.data.1.AllData), series __L010000000 (industry labour productivity, annual).
US Bureau of Labor Statistics (2024) Employment Projections — Industry–Occupation Matrix (Table 1.9) (for 2019 employment weights).
US Bureau of Labor Statistics (2024) Industry Productivity: Labor productivity, All workers, 2-digit NAICS, MachineReadable tables (Index 2017=100).
US Census Bureau (2024) 2022 Census Industry Code List with Crosswalk (SOC/NAICS harmonisation).