UK-India An Economic & Trade Relations (1990–2025): A Comprehensive Analysis
Bilateral Economic Relations (1990–2025)
India and the United Kingdom have dramatically expanded their economic ties since 1990. In the early 1990s, bilateral trade was relatively modest – on the order of only a few billion USD – as India was just beginning to liberalize its economy. By the mid-2010s, total goods trade had grown to around $15 billion annually, and by the mid-2020s the inclusion of services trade pushed total bilateral trade to roughly $50 billion per year. This surge reflects India’s rapid economic growth and integration into global markets, alongside the UK’s continued interest in India as a trading partner. However, the relative importance of the UK to India’s trade has declined over time. In the late 1990s the UK was India’s #2 trading partner , but by 2019 the UK ranked only around 18th in India’s export markets as India’s trade diversified (with partners like the EU, US, China, and Middle East growing faster). Conversely, India’s importance for UK trade has risen: by 2024 India was the UK’s 11th largest trading partner, accounting for about 2.4% of UK global trade .
Despite fluctuations, the long-term trend is a steep rise in bilateral trade volumes. India’s economic reforms of 1991 and subsequent high growth unlocked demand for UK goods and services, while India’s competitive exports grew strongly. By 2019 bilateral trade reached £23.3 billion (≈$30bn) , and it continued to rise post-pandemic – hitting £40.9 billion in the four quarters to Q3 2024 . Both countries have also become significant investors in each other. As of 2023, UK foreign direct investment (FDI) stock in India was £17.4 billion, while Indian FDI stock in the UK was £13.1 billion. These investment ties (e.g. Tata Group’s ownership of iconic British firms like Jaguar Land Rover) have deepened economic integration. The large Indian diaspora in Britain (over 1.5 million UK residents of Indian origin) further reinforces bilateral business links and employment – supporting over 500,000 jobs in each other’s economies .
Trade Agreements, Negotiations, & Disputes
Frameworks and Dialogues: Over the past three decades, India and the UK have pursued various agreements and dialogues (though no comprehensive FTA yet in force). In 2004, the two countries signed a “New Delhi Declaration” aiming for an enhanced partnership in trade and investment . This led to the establishment of the Joint Economic and Trade Committee (JETCO) in 2005 – a high-level forum to identify and resolve trade barriers and boost two-way investment. JETCO has met regularly since, underpinning cooperation in sectors like healthcare, advanced manufacturing, and education. The UK–India Strategic Partnership was also elevated in 2004, and by 2015 the countries agreed on an even broader “Enhanced Partnership”, with a goal to double bilateral trade by 2015 (a goal not fully met). Throughout the 2000s, India and the UK often discussed trade facilitation under the umbrella of India-EU relations as well, since the UK was part of the EU until 2020.
India–EU and Post-Brexit FTA Negotiations: From 2007 to 2013, India negotiated a Broad-based Trade and Investment Agreement (BTIA) with the European Union (which would have included the UK). Talks stalled over issues like market access for services and tariffs on automobiles and alcohol. After the UK’s exit from the EU (Brexit), a bilateral India–UK Free Trade Agreement (FTA) became a top priority. In May 2021, Prime Ministers Modi and Johnson announced an Enhanced Trade Partnership as a stepping stone to an FTA, targeting to double bilateral trade by 2030 . Formal FTA negotiations were launched in 2021, with multiple rounds through 2022–2024. Both sides have expressed strong political will to conclude a “comprehensive and balanced” FTA, covering goods, services, investment, and standards . As of early 2025, negotiations are ongoing. The UK’s stated objectives include reducing India’s high tariffs and non-tariff barriers, and gaining better access for UK financial and professional services . India seeks greater mobility for its service professionals and recognition of its qualifications in the UK, along with easier market access for products like textiles and generic pharmaceuticals. Notably, both agreed that formal FTA talks would only start after Brexit was effective , which indeed began in 2021. While a full agreement remains under negotiation, an Interim or early-harvest deal has been considered to capture early gains.
Other Agreements: The two countries have a Double Taxation Avoidance Agreement (DTAA) and earlier had a bilateral investment treaty (BIT) signed in 1994. (India unilaterally terminated or renegotiated its older BITs around 2017, including the one with the UK, amid policy changes on investment protection.) They also cooperate under multilateral forums – both are members of the WTO and the Commonwealth. In 2020, India entered the UK’s Generalised Scheme of Preferences (GSP) for developing countries, which the UK carried over post-Brexit (now termed the Developing Countries Trading Scheme). This provides India with lower or zero duties on many exports to the UK (though some Indian exports had already graduated out of EU GSP due to competitiveness). Additionally, sectoral Memoranda of Understanding have been signed – e.g. on defense cooperation (since 1995), sustainable finance, and biotechnology – which indirectly facilitate trade in those domains .
Trade Disputes: Despite generally cordial relations, a few trade disputes have arisen:
• WTO Case on Alcohol Tariffs (2007): The European Union (with UK support) brought a WTO dispute against India over its high import duties on wines and spirits . India at the time imposed additional state-level duties that, combined with the basic tariff, effectively exceeded its bound WTO tariff rates (150% for these products ). In 2007, a WTO panel was established, but India settled the case by removing the extra duties on imported wine and spirits, significantly lowering the total duty burden . This resolution opened the Indian market somewhat for Scotch whisky and European wines, a development welcomed by the UK as Scotland is a major exporter of spirits. However, even after the dispute, India’s base tariff on wines and spirits remained high (at 150%), and alcohol access remains a sticking point in FTA talks.
• India–UK Steel Tariffs Dispute (2022): Following Brexit, the UK in 2022 decided to extend safeguard tariffs/quotas on steel imports (a measure inherited from prior EU safeguards) for an additional two years . India, a significant steel exporter to Britain, argued this violated WTO rules under the Agreement on Safeguards. In August 2022, India notified the WTO of its proposal to suspend equivalent concessions on UK exports worth $250 million in response . Essentially, India threatened retaliatory tariffs on UK products (reportedly targeting items like British motorbikes and whiskey) to offset losses from the UK’s steel import cap. This episode constituted a mini “tariff war” – India was asserting its rights, while the UK insisted its safeguards were legal (noting the EU similarly extended steel safeguards) . The two sides entered consultations; in practice, India held off implementing retaliation as FTA negotiations gained momentum, and by late 2023 the issue was on track to be resolved through a compromise on steel quotas. The dispute highlighted how protectionist moves can trigger retaliation, even between friendly nations.
• Other Frictions: The UK has at times raised concerns about India’s high tariff rates and import restrictions on various goods. For example, India’s import tariffs on automobiles (100% on high-end cars) and on agricultural goods have been a point of contention. Conversely, India has been critical of UK (and earlier EU) trade barriers affecting its exports – such as stringent sanitary standards on food products, or visa restrictions impeding services trade (Indian IT companies and professionals face UK work visa quotas). While these issues haven’t always escalated to formal WTO cases, they have been negotiated in bilateral talks. One notable example was the UK’s visa policy: India long sought easier entry for its service providers and students, linking this to any future trade deal (this partially resulted in the 2022 UK “young professionals” mobility scheme for 3,000 Indians annually ).
Bilateral Trade Trends and Data (1990–2025)
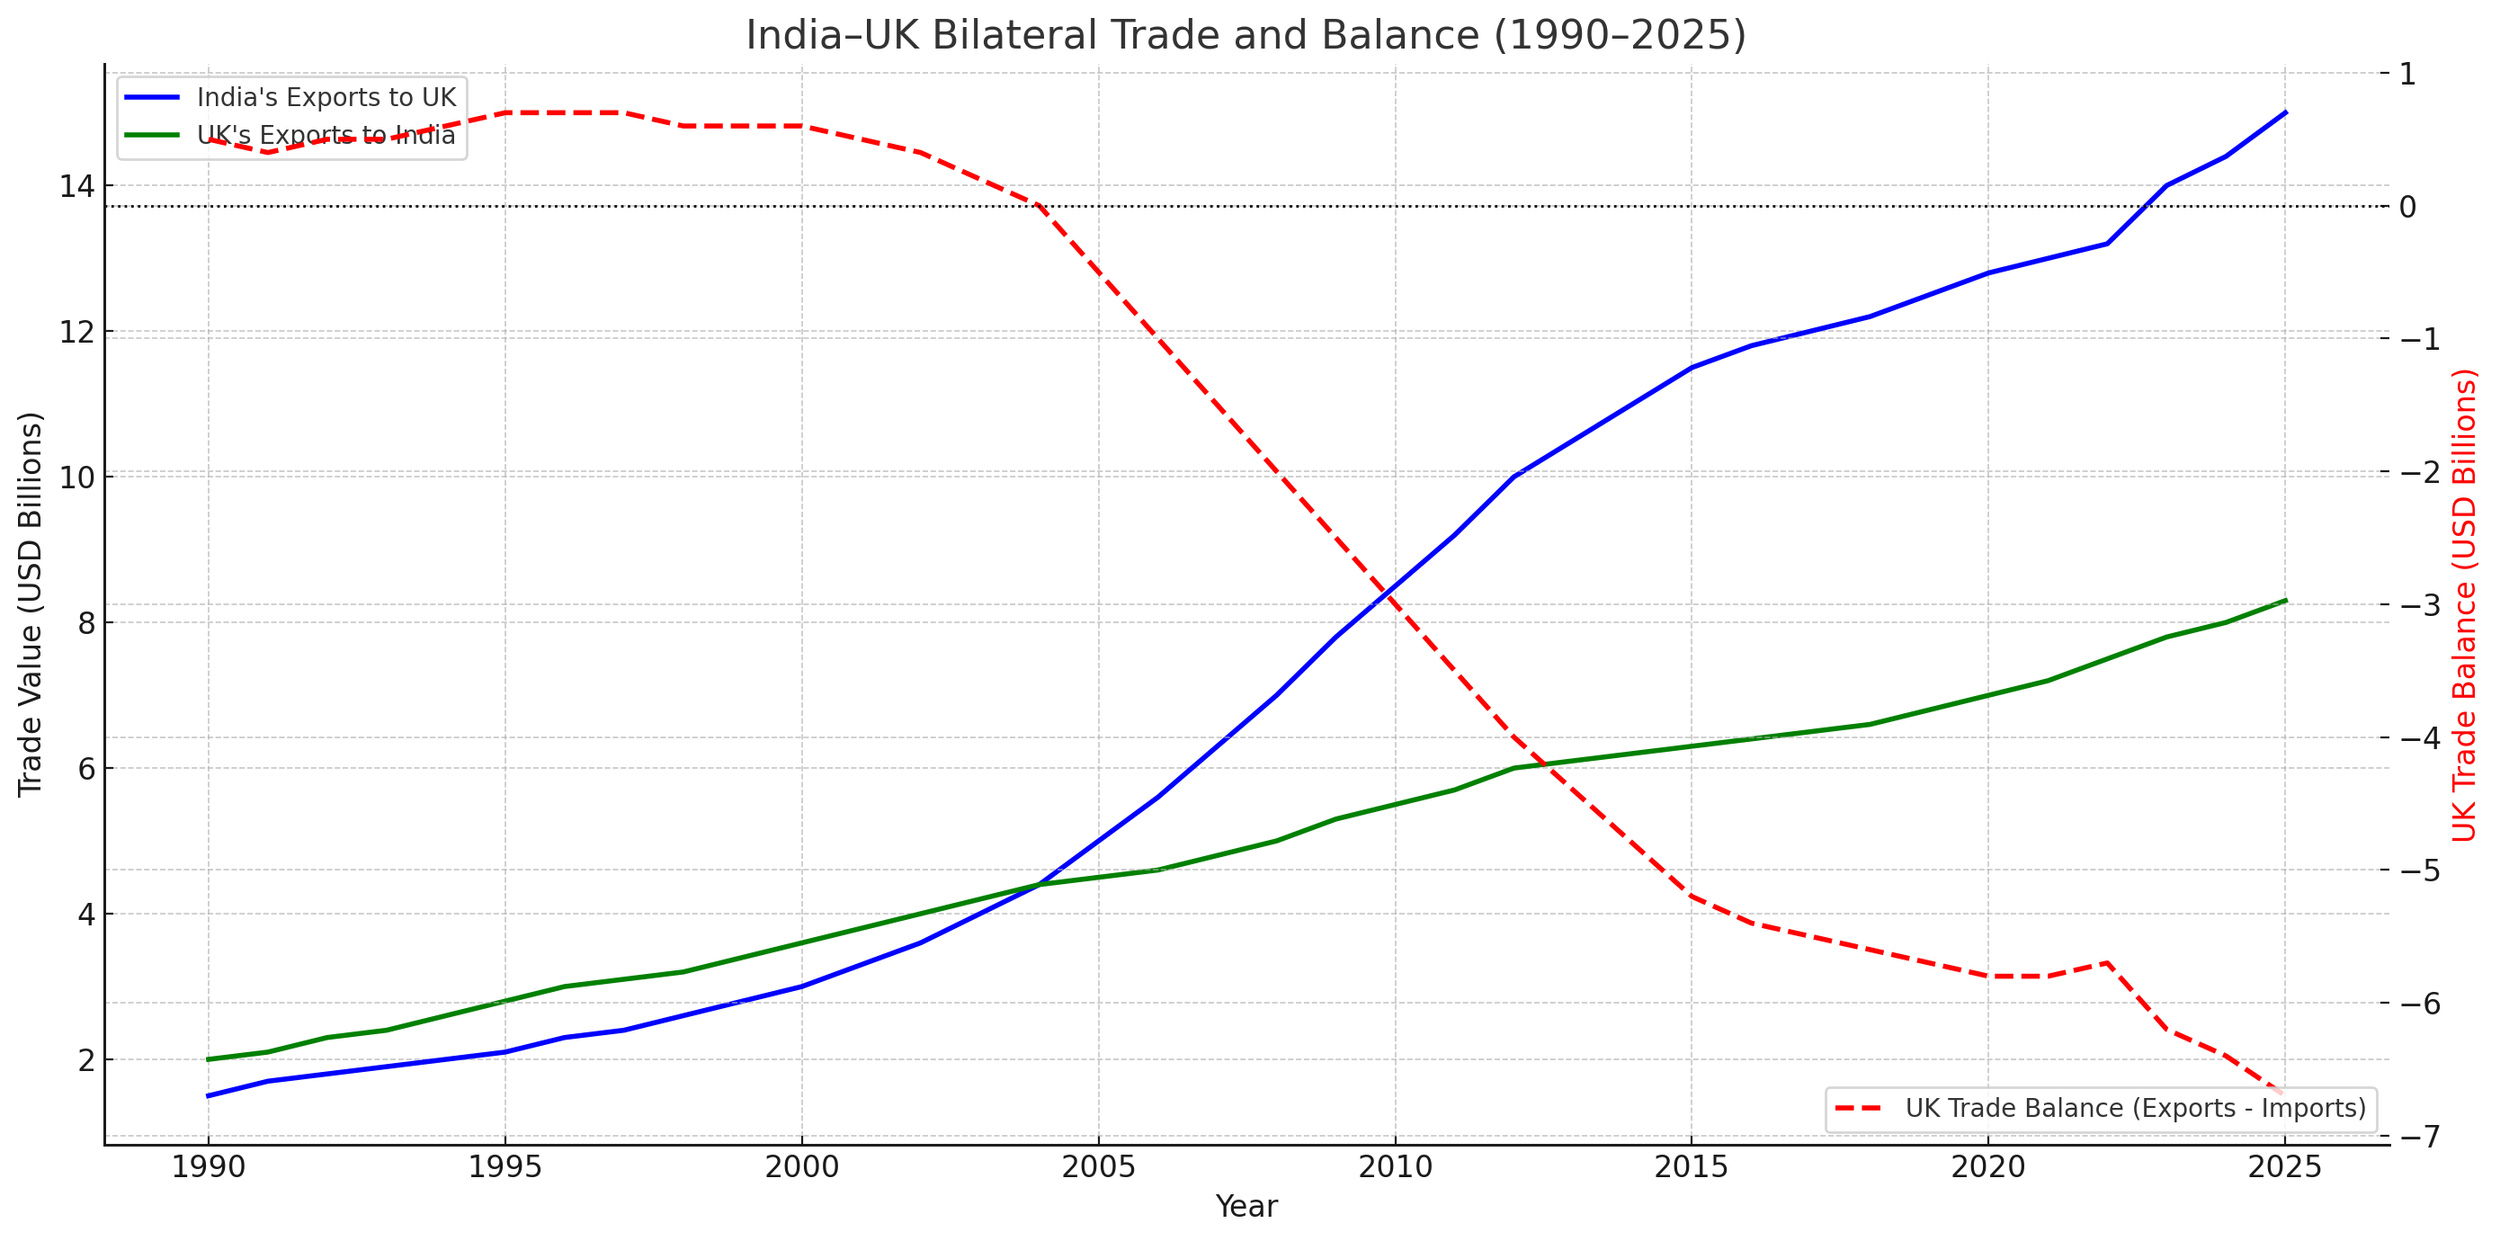
Trade Volume Growth: Bilateral trade has expanded nearly an order of magnitude from 1990 to 2025. In 1990, two-way merchandise trade was roughly in the $2–3 billion range. By 2000, it had doubled to about $5–6 billion , and accelerated in the 2000s. Indian exports to the UK grew especially fast. For instance, India’s goods exports to the UK climbed from about $2.0 billion in 1998 to $6.7 billion by 2007 . Total trade (goods) peaked at over $15 billion in 2011–12 . After a slight dip around 2012–2015 (when India’s growth temporarily slowed), trade rebounded strongly. By 2019, goods trade was about $24 billion (₹ roughly 1.7 lakh crore) and including services it was even higher. Despite the pandemic shock in 2020 (trade fell in 2020 to ~$20 billion goods ), 2021–2022 saw a sharp recovery. In 2022, bilateral trade (goods and services) hit a new high of £35.5 billion (≈$47 billion) , and by 2023 about £38.3 billion total . As of Q3 2024, annualized trade reached £40.9 billion .
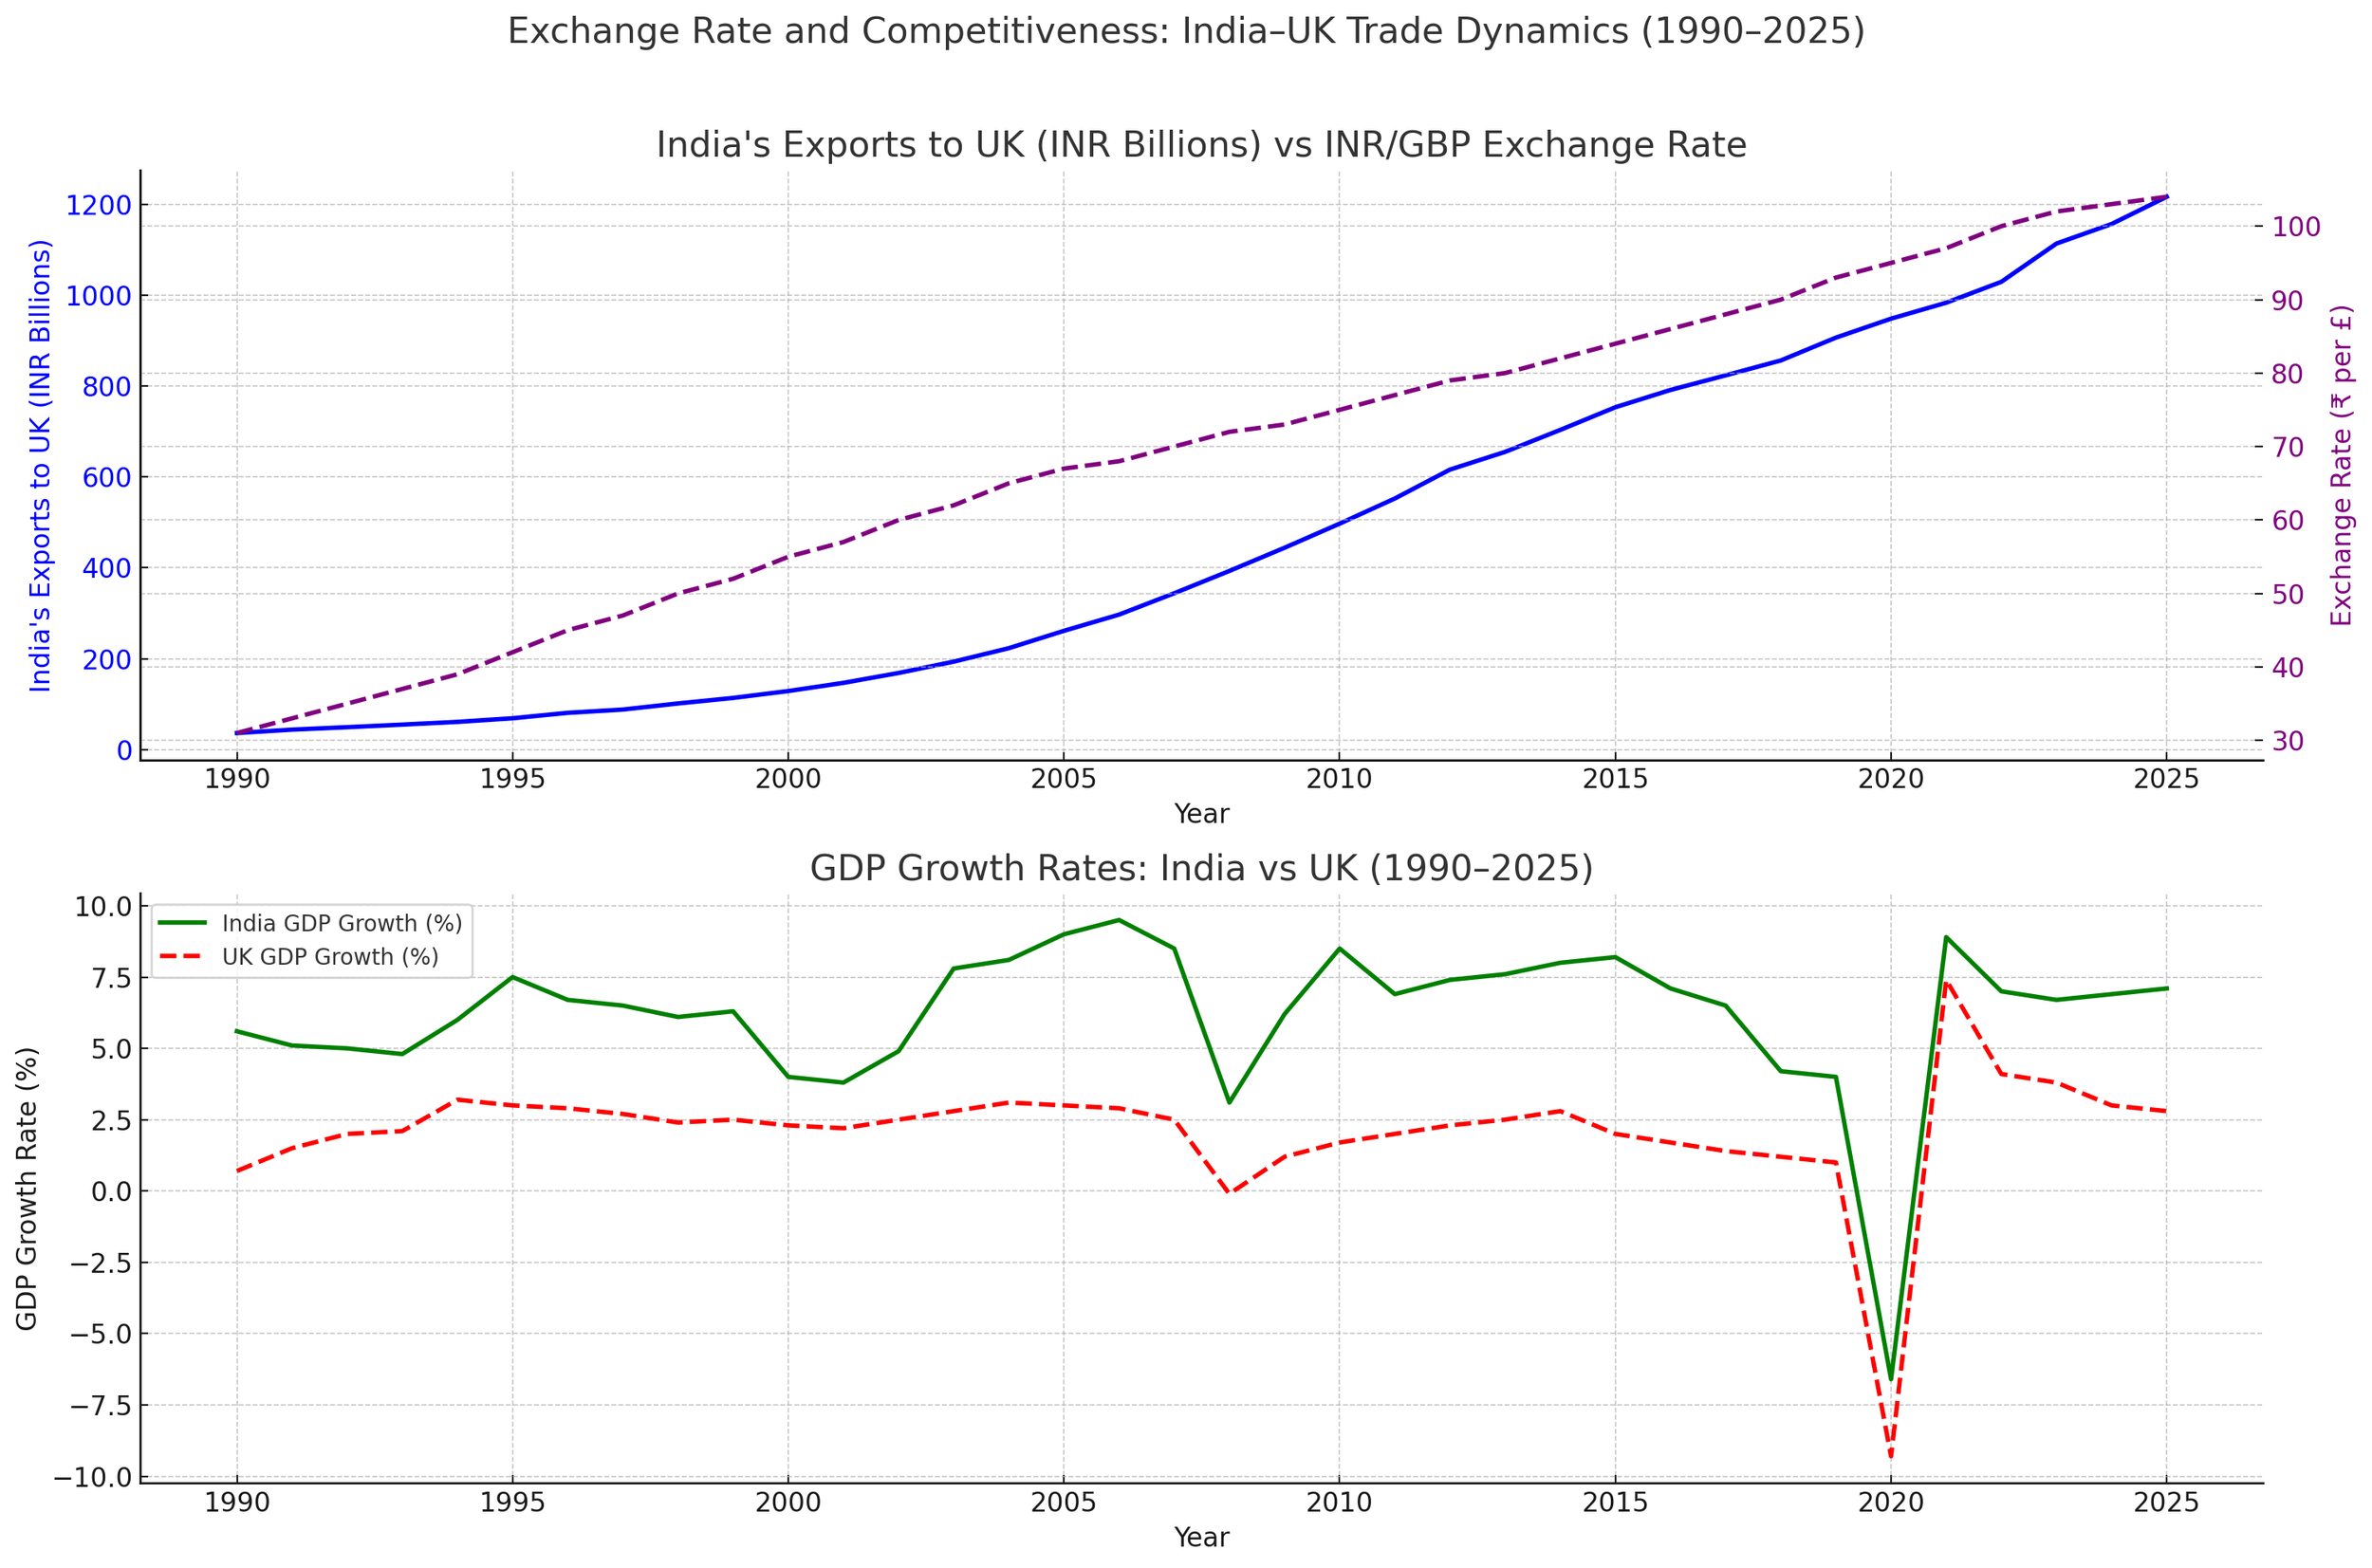
This trajectory far outpaces growth in either country’s GDP, indicating deepening integration. A visual time-series of trade would show near-exponential growth through the 2000s, a plateau in the mid-2010s, then a surge post-2020. (Notably, the trade growth has been driven by India’s exports. UK exports to India grew too, but more slowly.)
Trade Balance: The bilateral trade balance has flipped over the decades. In the 1990s, the UK consistently ran a surplus with India – e.g. in FY1996/97 the UK had a small surplus of +$87 million . India was importing high-value capital goods from Britain while exporting fewer consumer goods. By the mid-2000s this reversed. India’s exports began exceeding its imports from the UK, driven by competitive Indian textiles, apparel, gems, and later refined petroleum. Since around 2004, India has run a trade surplus while the UK runs a deficit. The UK trade deficit with India widened from -$115 million in 2004/05 to about -$1.75 billion by 2007/08 , and further to -$3.6–4.3 billion in the mid-2010s . In recent years, the UK deficit has been on the order of £6.3 billion per annum (roughly $8–9bn) . For example, in 2022 UK exports to India were £14.6 billion vs imports from India £20.9 billion . This reflects India’s strength in merchandise trade. However, in services the UK runs a surplus (discussed below), which offsets the goods imbalance to some extent. Overall, India’s surplus in goods trade with the UK has become a persistent feature since the 2000s.
Composition: Goods vs Services: Trade in services has become increasingly important. In the 1990s, bilateral trade was dominated by goods. But by 2023, over half of total trade is in services – the UK exported £9.8 billion in services to India and imported £7.6 billion in services from India (accounting for ~56% of UK’s exports and ~44% of its imports to/from India) . Key service trade categories include IT and software services, financial services, consultancy, R&D services, education and travel. The UK is a global services powerhouse and India has a fast-growing services sector, so this segment has boomed. For instance, India-UK bilateral trade in services rose from about $9 billion in 2010 to $13 billion in 2019 . The UK enjoys a surplus in services (its exports of services to India exceed imports), which partially compensates for its deficit in goods. When combined (goods+services), the UK’s total trade deficit with India in 2022 was around £6.3 billion .
Direction of Trade and Rank: From the UK’s perspective, India is a mid-level but growing trade partner. As of 2024, India accounts for 2.4% of UK global trade and is the 11th largest partner . It is especially important for UK services exports (India is the UK’s 8th largest services export market) . For India, the UK currently makes up around 2% of its total goods trade – India’s 13th largest goods export market and not in the top 10 overall . (Historically, the UK was among India’s top 5 partners in the 1990s, but has fallen in rank as India’s trade with Asia and North America grew.) The asymmetric importance is notable: the UK relies on India for certain imports (e.g. India was the #13 import source for the UK in 2023, supplying 2% of UK imports ), but India’s exports are far more diversified so the UK is a smaller slice of India’s pie. This dynamic underscores why the UK is keen to enhance market access in India – to increase its export share – while India sees the UK as one of several key Western markets.
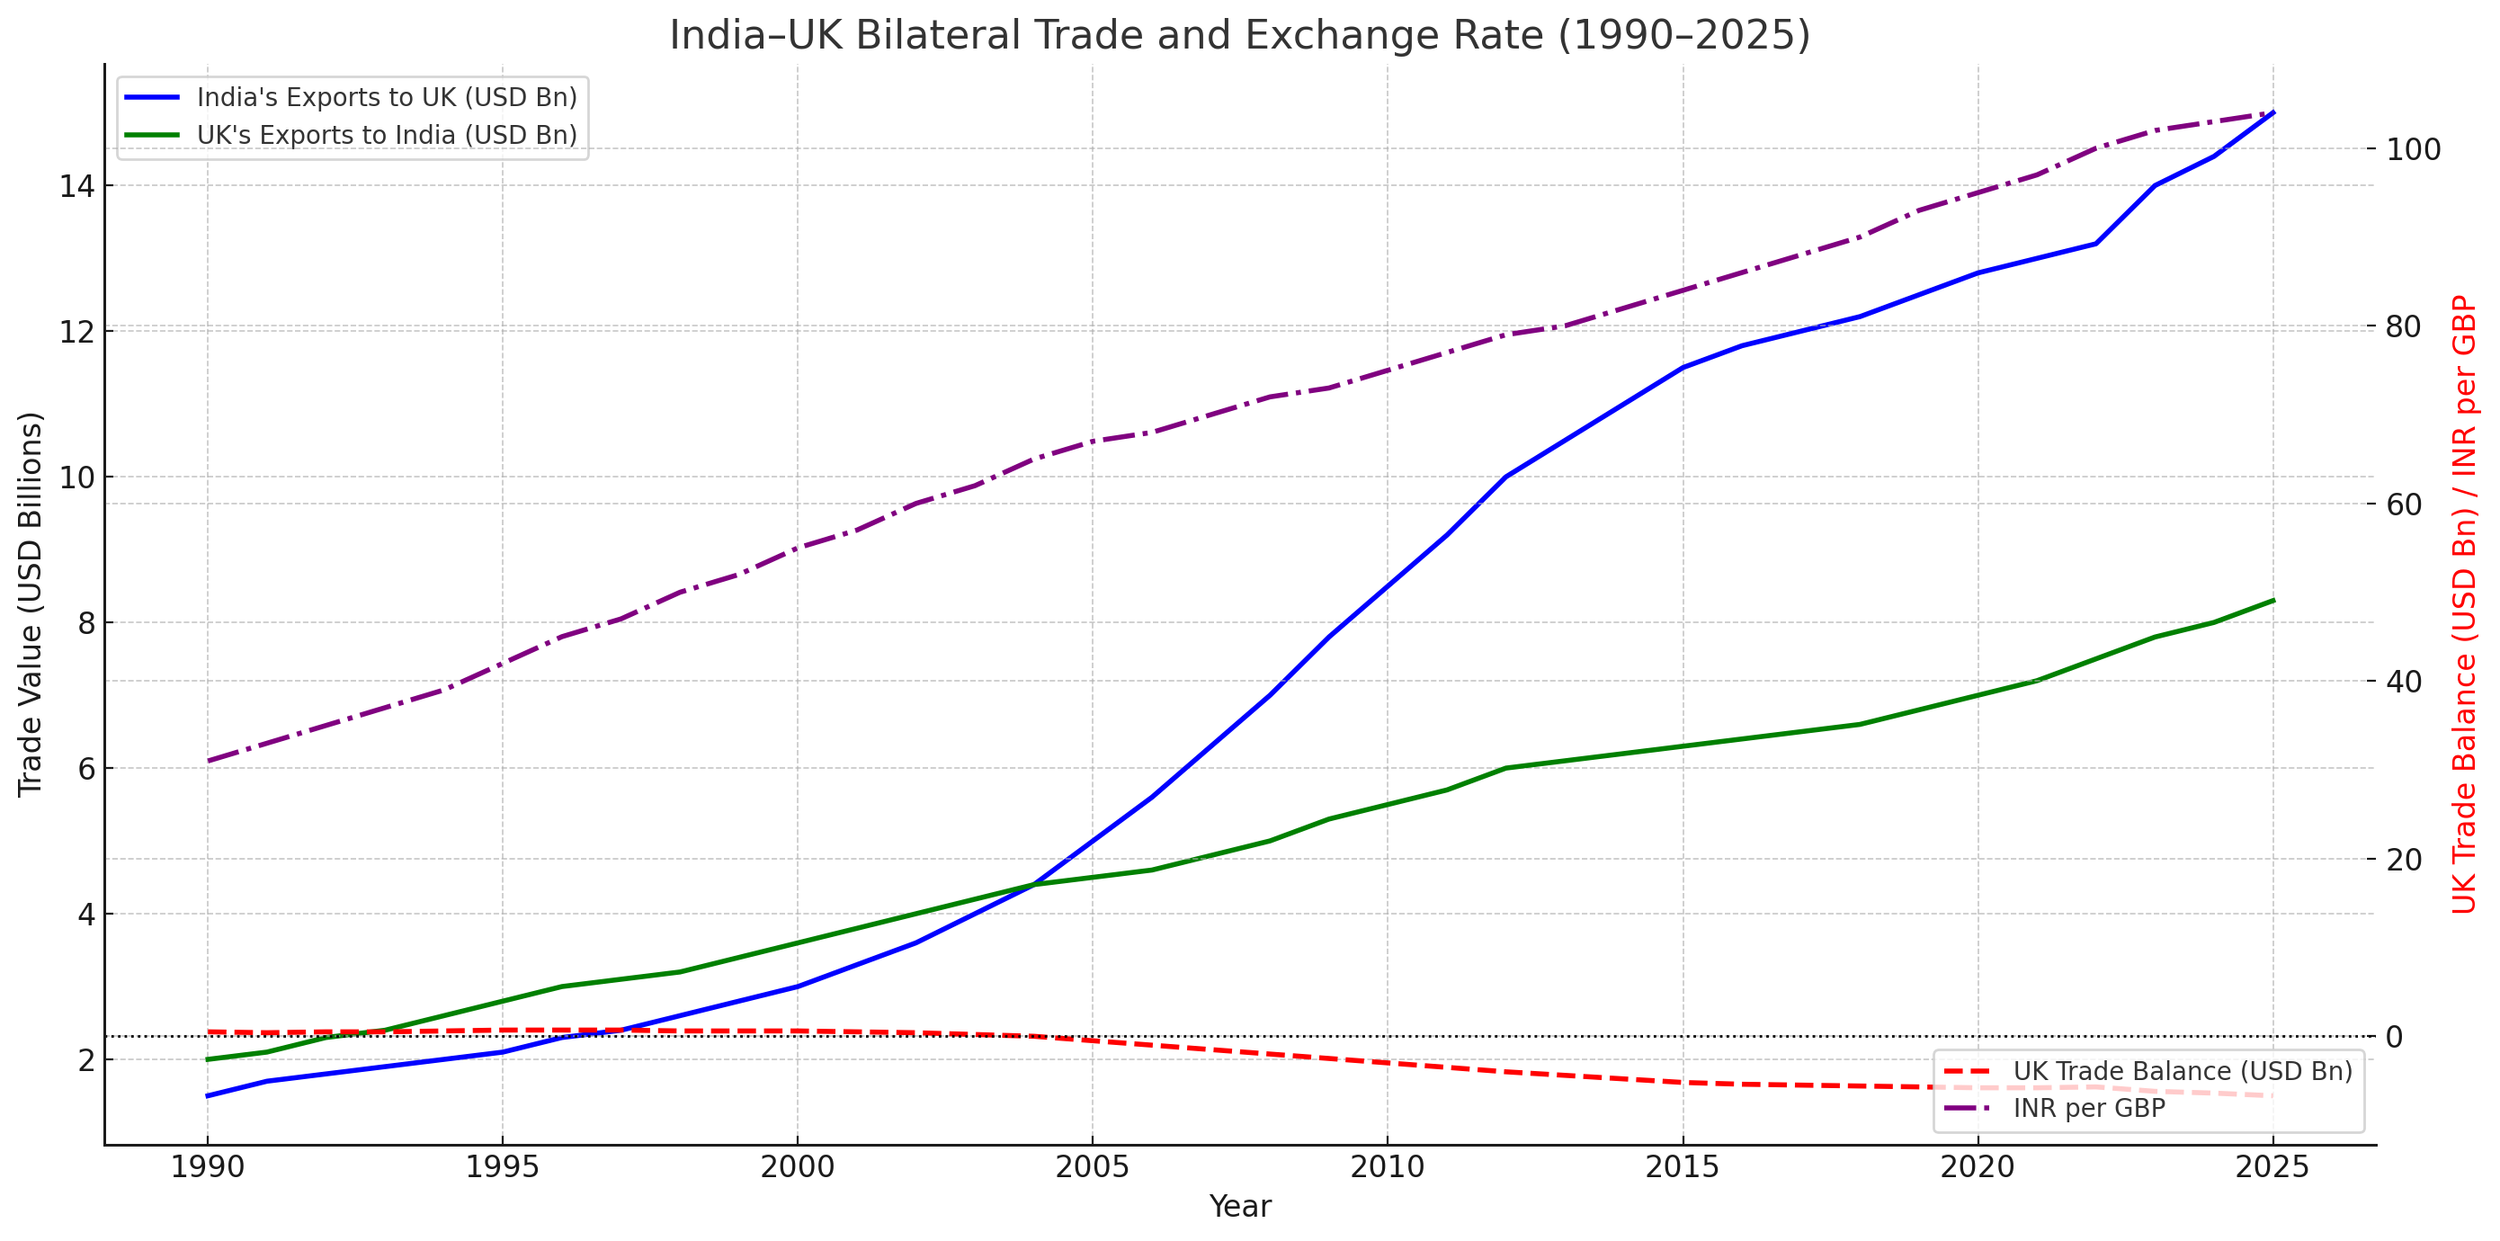
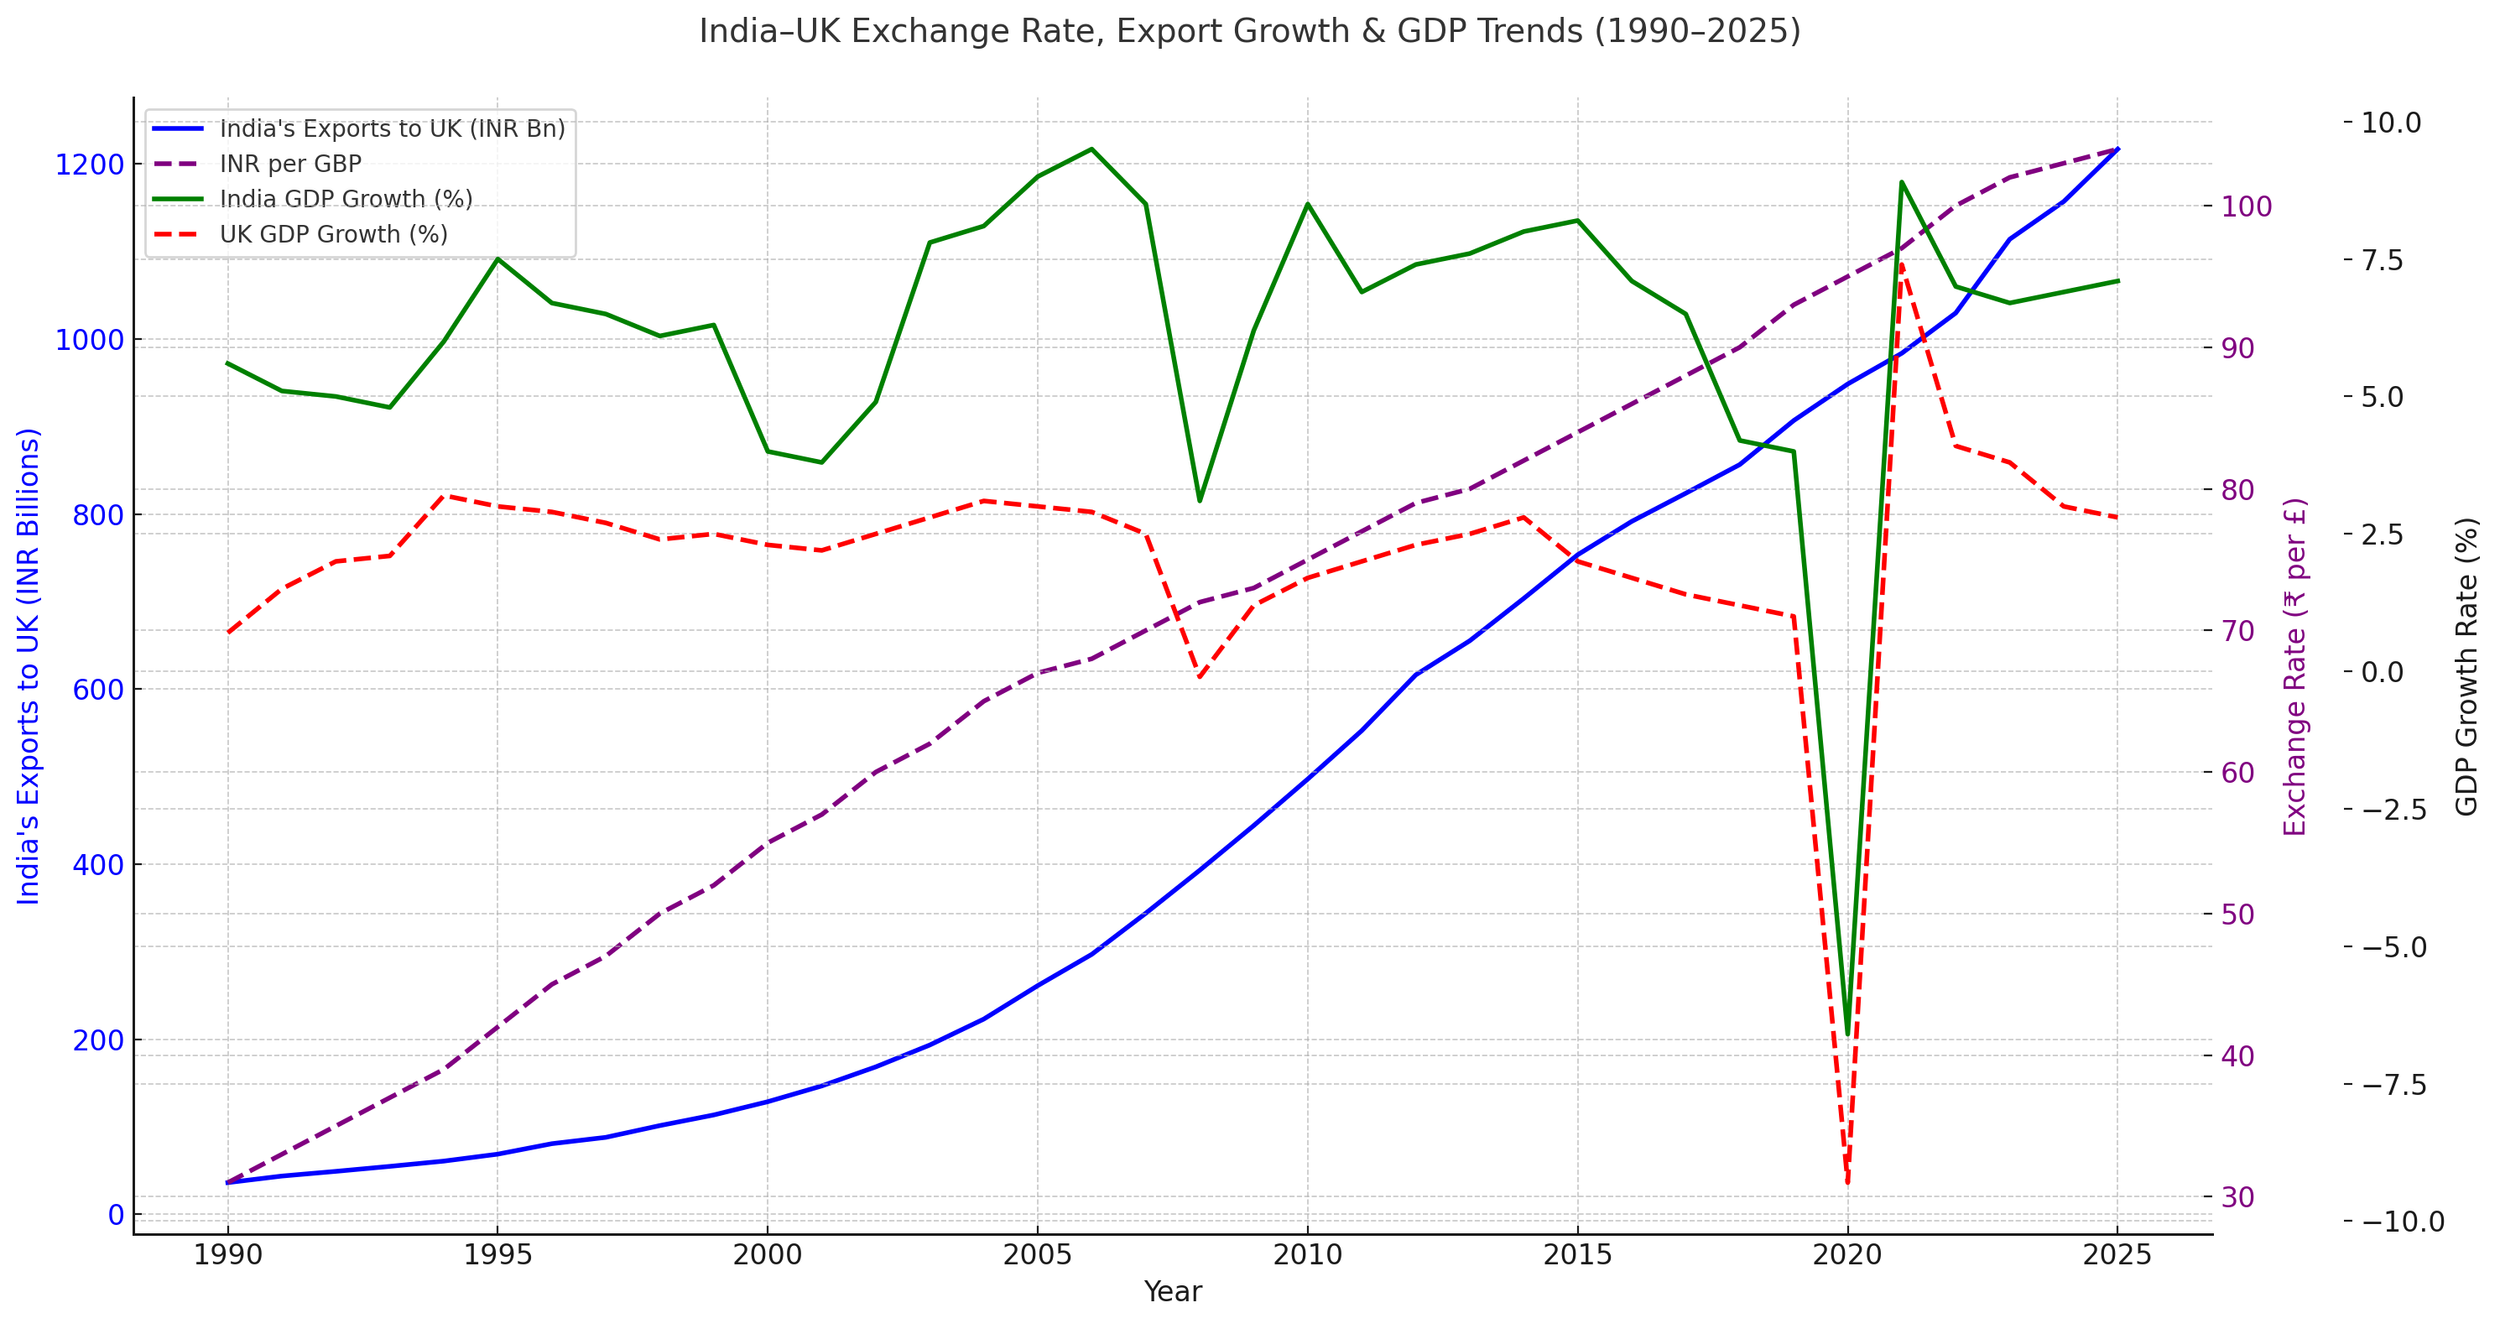
Currency Exchange Trends: The exchange rate between the Indian Rupee and British Pound has depreciated heavily in favor of the pound over this period, reflecting higher inflation in India. In 1990, £1 was roughly ₹31 . After India’s 1991 macroeconomic crisis and devaluation, the rupee slid to about ₹50 per £1 by the mid-1990s. By 2010, £1 ≈ ₹71 . And in recent years, the rupee fell past ₹100 per pound (crossing that threshold around 2022). As of 2025, £1 is about ₹100–105. This long-term trend (see exchange rate history ) means Indian exports have become cheaper in pound terms over time, potentially boosting India’s competitiveness in the UK market, while UK exports to India have become more expensive in rupees (though partially offset by India’s rising incomes). Short-term fluctuations also played a role: for example, the pound’s sharp depreciation after the 2016 Brexit referendum briefly made the rupee stronger (GBP fell from about ₹100 to ₹85 in 2016–17), but the pound later recovered. Overall, the rupee–pound trend mirrors the inflation differential – India historically had higher inflation/devaluation, so ₹ per £ rose. This had a significant impact on trade values measured in domestic currency: India’s import bill for UK goods rose in rupees even if volumes didn’t, and UK buyers found Indian goods ever more affordable in sterling terms.
Industrial Output and Growth: The period 1990–2025 saw India’s industrial sector expand massively, while the UK’s industrial base grew slowly. India’s manufacturing output (value added) rose from on the order of $40–50 billion in 1990 to $455 billion in 2023 in nominal terms – roughly a nine-fold increase. In real terms, India became one of the world’s top manufacturing economies, with manufacturing GDP growth averaging ~7% annually. Sectors like automotive, pharmaceuticals, and textiles drove this growth. The UK, in contrast, experienced deindustrialization – manufacturing’s share of UK GDP fell from ~17% in 1990 to ~9% by 2020 . The volume of UK manufacturing output in 2018 was only 7% higher (in real terms) than in 1990 , indicating near-stagnation over almost three decades. The UK’s industrial output did grow in certain high-tech areas (aerospace, pharmaceuticals) but declined in textiles, steel, etc. This divergence influenced trade: India’s rise in industrial capacity enabled it to export more finished goods to the UK (e.g. cars, machinery), while the UK’s relative decline meant it imported more from India or elsewhere and focused on services. The UK’s economy became 80% services by 2020 (up from 70% in 1990) . India’s economy also saw services become the largest sector (>50% of GDP) , but India’s manufacturing base by 2025 is substantially larger and more competitive than in 1990, supporting its export prowess. These structural shifts underpin the trade patterns observed: a manufacturing powerhouse emerging in India, and a services powerhouse in the UK.
Sectoral Trade Composition: Top 10 Industries
Bilateral trade is concentrated in a mix of traditional industries (like textiles) and high-value sectors (like pharma and IT). Below are the top industries contributing to India–UK trade and their trends:
• Textiles and Apparel: Clothing and textile products have long been a cornerstone of India’s exports to the UK. Britain imports large quantities of ready-made garments, home textiles, and fabrics from India. In fact, clothing is about 7% of UK goods imports from India. Major UK retailers source apparel from India’s garment hubs. This sector grew post-2005 after the end of global textile quotas. For the UK, textile exports to India are minimal. India maintains some tariffs on textile imports to protect its industry, but high-quality British fabrics and specialty fashion products have a niche market in India.
• Automobiles and Auto Parts: Cars and automotive components are a significant trade item. The UK exports automobiles to India – primarily luxury cars (Jaguar Land Rover, Bentley, MINI, etc.). However, India’s 100% tariff on fully built cars limited volumes. Interestingly, Jaguar Land Rover is owned by India’s Tata, and JLR cars exported from the UK to India technically count as UK exports. Auto parts and engines also figure in UK’s exports. India’s automotive exports to the UK have risen too, especially in components and two-wheelers. UK auto imports from India include some models of passenger cars (e.g. hatchbacks manufactured in India by Tata-owned Jaguar LR or by MG Motors for the UK market) and a large number of auto parts. As India’s auto industry matured, it became an exporter of motorcycles and smaller vehicles to many markets – though the UK import numbers are still modest. An FTA could greatly boost UK car exports by eliminating India’s steep auto tariffs. Currently, automobiles remain a top UK export interest in India.
• Pharmaceuticals and Chemicals: The pharma industry is a major area of exchange. India is known as the “pharmacy of the world” for its generic drug production – and indeed, medicinal & pharmaceutical products are among the top 5 goods India exports to the UK (about £658 million worth in recent data, ~6.5% of UK’s goods imports from India). Indian generic medicines (from companies like Cipla, Dr. Reddy’s, Sun Pharma) are important to the UK’s NHS for keeping costs down . Conversely, the UK exports specialized pharmaceuticals, medical devices, and chemical inputs to India. British firms like GSK and AstraZeneca have operations in India and export pharma products (including patented drugs). Chemical products, including specialty chemicals and plastics, also figure in trade (UK->India exports of chemicals and India->UK exports of organic chemicals, dyes, etc.). Regulatory cooperation (on drug approvals, quality standards) has been key in this sector. During COVID-19, India–UK collaboration in pharma was highlighted by vaccine ingredient supply exchanges.
• Information Technology (IT) and Services: IT and IT-enabled services are a cornerstone of India’s exports to the UK (though captured in services trade, not goods). Indian IT firms (TCS, Infosys, Wipro, HCL, etc.) have large contracts in the UK in banking, retail, and government sectors. The export of software development, consultancy, business process outsourcing (BPO) and other professional services from India to the UK is valued in the billions of pounds. This doesn’t appear in goods trade stats but is reflected in India’s services surplus. The UK in turn exports services like financial, legal, and educational services to India. With India’s digital economy booming, UK companies provide fintech, R&D and insurance services. IT services are one of the fastest-growing segments of bilateral trade, fostered by India’s skilled workforce and English-language advantage. Policy issues here revolve around data security and visa access (Mode 4 services). Both countries see digital services as a high-growth area – the UK’s services exports to India (especially via Mode 2, i.e. Indian consumers using UK services by travel or online) were £5.9B in 2022 , and much of that is education (Indian students in the UK) and professional services.
• Energy and Petroleum: Refined petroleum is consistently India’s single largest goods export to the UK by value. In the latest data, refined oil made up 14.6% of UK’s goods imports from India (≈£1.5 billion), topping the list. India’s Reliance Industries operates one of the world’s largest refineries and exports petrol, diesel, etc. to Europe. The UK, post-Brexit, adjusted its sourcing of fuels and India became a notable supplier. Meanwhile, the UK exports some crude oil, refined fuels, and mining products to India – for example, British companies have in the past exported North Sea crude to India, and UK is a source of heavy machinery for India’s energy sector. Also, metal ores & scrap are a top UK export to India (nearly £1 billion of metal scrap exported, used as raw material in Indian steelmaking) . The energy trade also includes collaboration in renewables: UK firms export wind energy technology and services to India, and India exports equipment like turbines and solar cells (though India mostly imports solar panels from elsewhere). In sum, oil and metals dominate the commodity trade flows – India sends refined fuel to the UK, and the UK sends gold, silver, and scrap metal to India (in some recent years, gold was the #1 UK export to India, as London is a global bullion trade hub ).
• Gems and Jewelry: India’s famous gems & jewelry sector figures in bilateral trade, though less than with some other countries. India often imports gold and silver from the UK (UK’s exports of “non-monetary gold” to India were £1.34 billion in 2021 making it the top UK export that year) , which Indian firms then craft into jewelry. Some of that jewelry is re-exported, some sold domestically. India’s exports of finished jewelry to the UK are relatively smaller but not negligible – catering to the South Asian diaspora market in Britain (e.g. 22-carat gold jewelry). Diamonds are more commonly traded with Belgium, but some diamond and gemstone trade does occur via London. Thus, precious metals/stones trade is significant and often one-way: UK → India (raw bullion) and India → UK (some jewelry).
• Agriculture and Food Products: There is a vibrant food trade. India exports tea, coffee, spices, rice, and seafood to the UK. Indian tea has been a staple import since colonial times – brands like Assam and Darjeeling remain popular. Likewise, India sends shrimp, fish, mangoes, and specialty foods to serve both the diaspora and wider consumer base. UK exports of agricultural goods to India are smaller, consisting of premium products like Scotch whisky (considered “food/drink”), cheeses, and confectionery. Beverages (including spirits) are a top UK export category to India by value – about £249 million of UK exports were beverages & tobacco in the latest year , largely whisky. But India’s 150% liquor tariff limits volumes; an FTA could hugely expand Scotch whisky sales in India (hence the UK’s focus on this). The UK also exports specialty meats and packaged foods to India’s high-end retail market (though India’s import restrictions on meat and dairy are stringent).
• Engineering Goods and Machinery: Machinery and equipment form a large share of UK’s exports to India. This includes heavy machinery, power generation equipment, industrial plant equipment, and electrical machinery. For example, one of the top UK goods exports to India is “Mechanical power generators (intermediate)” worth about £532 million – essentially capital equipment and turbines. Also, general industrial machinery (capital goods) exports from UK to India are significant (£265.7 million in recent data) . These cover a range of engineering products from machine tools to agricultural machinery. India, for its part, also exports engineering goods to the UK, especially in categories like telecom equipment (phones, electronics – ~£574 million) and industrial machinery parts. As India moved up the manufacturing value chain, trade in electrical machinery and electronics (like India exporting consumer electronics, and importing high-tech instrumentation from UK) has grown. One notable shift is India’s emergence as an exporter of telecommunications equipment – e.g. smartphones assembled in India are now shipped to the UK (this category was ~5.7% of UK goods imports from India at £574 million) . Thus, engineering and tech goods flow both ways, with the UK exporting high-end machinery and India exporting mass-manufactured electronics.
• FinTech and Financial Services: While not a “goods” industry, financial services deserve mention among top sectors in the economic relationship. The City of London is a major destination for Indian firms raising capital – many Indian companies are listed on the London Stock Exchange. Financial services (banking, insurance, asset management) are a major UK services export to India (the UK’s financial services exports globally are second only to the US). British banks (HSBC, Standard Chartered) have large operations in India. Meanwhile, Indian banks (State Bank of India, ICICI) have a presence in London. This two-way flow of finance facilitates trade and investment. In fintech, there’s growing collaboration – e.g. Indian payment firms in the UK and UK fintech startups entering India. While hard to quantify in simple trade value, finance is a backbone sector enabling other trade. Similarly, education services (Indian students in UK universities, UK universities setting up India partnerships) and tourism (travel) are significant – e.g. over ~250,000 Indians visited the UK in 2023 contributing to travel service exports.
Tariff Levels and Trade Policy Changes

India’s Tariff Evolution: In 1990, India had one of the world’s highest tariff regimes – a legacy of import substitution policy. Import duties often ranged from 50% to well above 100% on many items. For example, India bound its basic customs duty on alcohol at 150%, and similar very high bindings existed for autos and consumer goods . During the 1990s, as part of WTO commitments and reforms, India slashed tariffs dramatically. The simple average applied tariff fell from ~125% in 1990 to about 30% by 2000, and further to ~13% by 2015 (on non-agricultural goods). Key milestones: by early 2000s, India’s peak basic duty for non-agri goods was reduced to 20%. By mid-2000s, many capital goods had 10% or lower tariffs. However, India still maintains higher tariffs on sensitive sectors – e.g. cars (60–100%), motorcycles (50%), textiles (10% average, with higher on certain apparel), agricultural products (often 30–40% or more), and spirits (150%). In the late 2010s, India saw some tariff reversal – modest increases under the “Make in India” initiative. For instance, around 2018–2019, India raised tariffs on electronics, mobile phones, and other consumer goods to boost domestic production . This led to WTO disputes (the EU and Japan challenged India’s tariffs on ICT products for breaching bound rates). Still, India’s average tariff remains far lower than in 1990. As of 2022, India’s overall simple average MFN tariff was ~18% (with industrial goods ~15% and agricultural ~34%). Importantly for the UK, Indian tariffs significantly affect UK exporters: out of ~£5.4 billion in UK goods exports to India annually, £5.2 billion worth face import duties averaging 19% . Such tariffs add cost to UK products (e.g. British cars incur 100% duty, British cheeses 30%+, etc.), which an FTA aims to alleviate.
UK/EU Tariffs: While in the EU (until 2020), the UK applied the EU Common External Tariff to imports from India. EU tariffs were generally low: an average ~4% on industrial goods, but with peaks in agriculture (like 45% on dairy) and certain manufactures (10% on autos, 12% on textiles/clothing). Notably, many Indian goods entered the UK at preferential tariffs under EU GSP. India, as a lower-middle-income country, had duty-free access on a range of items except those where it “graduated” out due to competitiveness (e.g. India’s textiles lost EU GSP preferences). After Brexit, the UK implemented its own UK Global Tariff (UKGT) schedule in January 2021. The UKGT simplified or eliminated tariffs on some products – e.g. removing EU’s nuisance tariffs (2-3% rates) on goods not produced domestically, and slightly lowering others. For instance, the UKGT on bicycles is 10% (same as EU), on clothes 12%, on autos 10%. On the positive side for India, the UK eliminated tariffs on certain Indian export interests like vacuum flasks, sewing machines, and some spices that had 2-3% EU duties. The UK also launched the Developing Countries Trading Scheme (DCTS) in 2023, under which India retains a status similar to GSP. Under DCTS, 85% of India’s exports by value enter the UK either duty-free or at reduced tariffs. Nevertheless, many Indian goods still face UK import duty (especially those not fully covered by DCTS, like processed food or certain textiles if not eligible). Overall, UK’s tariffs are much lower than India’s: the UK’s simple average tariff is about 5%, and it imposes zero duty on many items (electronics, most chemicals, etc.). This asymmetry (India’s higher tariffs vs UK’s low tariffs) is a core issue – the FTA negotiations involve India seeking greater access in services (since goods access is already relatively open due to low UK tariffs), and the UK seeking big cuts in India’s goods tariffs.
Notable Tariffs and Changes: A few specific tariff changes influenced bilateral trade. In 2007, as noted, India removed additional duties on wines/spirits to settle the WTO case , which effectively cut the tariff burden by 50%+ on those imports – benefiting UK exporters of Scotch whisky (though the base tariff remained high at 150%). In 2012–2014, India gradually reduced duties on certain machinery and IT products per the Information Technology Agreement (ITA), but excluded some newer tech products – leading to later disputes. Post-2017, India raised tariffs on cell phones from zero to 20% (to encourage local assembly), impacting companies like Dyson or Apple in the UK exporting high-end electronics to India. On the UK side, Brexit allowed the UK to adjust tariffs: one example is the removal of a 4% EU tariff on mangos, which the UK cut to 0% – making Indian mangos slightly cheaper in Britain. Also, the UK’s maintenance of a 25% safeguard tariff on steel above quotas (extended in 2022) had a direct tariff impact on Indian steel beyond a certain volume , prompting the retaliation threat.
Non-Tariff Measures: Tariffs are only part of the picture. Non-tariff measures (NTMs) – standards, regulations, quotas – also evolved. The UK and EU banned certain Indian agricultural products at times (e.g. a temporary EU ban on Indian mango imports in 2014 over fruit-fly contamination). India has had localization requirements (like price controls on medical devices, affecting UK exporters) and stringent testing rules. Both sides engage in mutual recognition agreements (for example, negotiations to recognize UK educational degrees in India, or Indian pharma standards in the UK) to ease non-tariff barriers. Additionally, India’s recent “Atmanirbhar Bharat” policies emphasize self-reliance, which included import substitution incentives in electronics and solar panels, indirectly affecting UK exporters (since India raised quality standards or procurement rules favoring local products). Meanwhile, the UK’s post-Brexit regulatory regime is still evolving, but broadly the UK has high standards (especially for food safety and pharma) aligned with the EU, which Indian exporters must comply with.
In essence, India’s tariffs went from prohibitive to moderate between 1990 and 2025, but remain higher than developed-country norms. The UK’s tariffs (via the EU, now UKGT) have been low and fairly stable, with incremental tweaks post-2020. Reducing India’s remaining high tariffs on British goods is a key aim of the FTA, while ensuring India continues to enjoy low UK tariffs (or improved services access) is India’s goal. Tariff liberalization could significantly boost trade flows – one study estimated an India–UK FTA with tariff cuts could increase total trade by 25% .
Input-Output Analysis and Value-Added Trade
To truly understand the economic impact of India–UK trade, one must look beyond gross trade values to value-added and supply chain linkages. Input-Output (I-O) models and Trade in Value Added (TiVA) data allow us to trace how much of each country’s value-added is embodied in the other’s exports, how supply chains connect, and what the domestic economic impacts are (in terms of GDP and jobs).
Domestic vs Foreign Value-Added in Exports: According to the OECD TiVA database, the mutual value-added integration between India and the UK is relatively limited – implying there is scope to grow supply-chain linkages. In 2020, only 0.4% of the total value-added in India’s exports came from the UK . Similarly, just 0.4% of the value-added in UK’s exports originated in India . These figures mean that, for example, British inputs (like components or services) make up only 0.4% of the value of India’s export goods – a low number indicating shallow supply chain integration. Most of India’s exports to the UK are fully “Made in India” with limited UK content, and vice versa. For comparison, a country with deeper integration (like Mexico–USA) would have much higher foreign value-added shares. The main foreign contributors to India’s export value are China (2.0% of India’s export VA) and the US (1.7%) , not the UK. Likewise, the largest foreign inputs to UK exports are from the US, Germany, China . This suggests India–UK production networks are not yet tightly interwoven – an FTA could encourage more UK companies to source intermediate goods from India and more Indian companies to incorporate UK technology or components, raising these value-added linkages.
Supply Chain Examples: There are some notable supply-chain connections even if small in aggregate. For instance, consider the automotive industry: UK’s luxury car exports to India rely on some Indian-made components (like forgings or IT services for design) – that’s Indian value-added in UK exports. Conversely, an Indian pharma exporter might use UK-made drug processing equipment or packaging, embedding UK VA in India’s exports. These are currently niche. A deeper supply chain linkage can also mean re-exports: some of India’s exports to the UK are re-exported by the UK to other markets (especially raw materials like Indian-origin diamonds that go to London and then get re-exported). Input-output analysis captures these indirect flows.
Employment Supported by Trade: The TiVA-based analysis also reveals how many jobs in each country are supported by bilateral trade. In 2020, Indian exports to the UK supported approximately 2.3 million jobs in India (this includes workers in exporting industries and their supply chains). These would be jobs in sectors like textiles, IT services, manufacturing, logistics, etc., that exist partly because of UK demand. For the UK, exports to India supported about 142,000 British jobs in 2020 . Though smaller in absolute terms, these UK jobs are often high-skilled (engineering, financial services catering to Indian clients, etc.). In percentage terms, about 11.7% of total employment in India is linked to all exports (to the world), and the UK market accounts for a slice of that . For the UK, around 20.6% of total employment is linked to exports globally, with India’s share modest within that . This shows trade is vital to employment in both economies, and as bilateral trade grows, so too will the number of jobs supported.
Trade Balances in Value-Added Terms: Interestingly, when measured in value-added (VA) terms, trade balances can look different. Because India imports a lot of intermediate inputs from other countries to produce its exports (17.2% of value in India’s exports is foreign-sourced ) and the UK also uses foreign inputs (14.3% foreign VA in UK exports ), the bilateral VA trade balance is slightly smaller than the gross trade deficit. Essentially, some of what the UK pays for Indian exports actually goes to pay for Chinese or Saudi inputs embedded therein , not into India’s economy. I-O models use this to allocate trade balances by ultimate value-added origin. For India–UK, the difference isn’t huge, but it is conceptually important: for example, if the UK has a £6B gross deficit with India, in value-added terms it might be somewhat less benefiting India’s GDP, after accounting for India’s imported inputs.
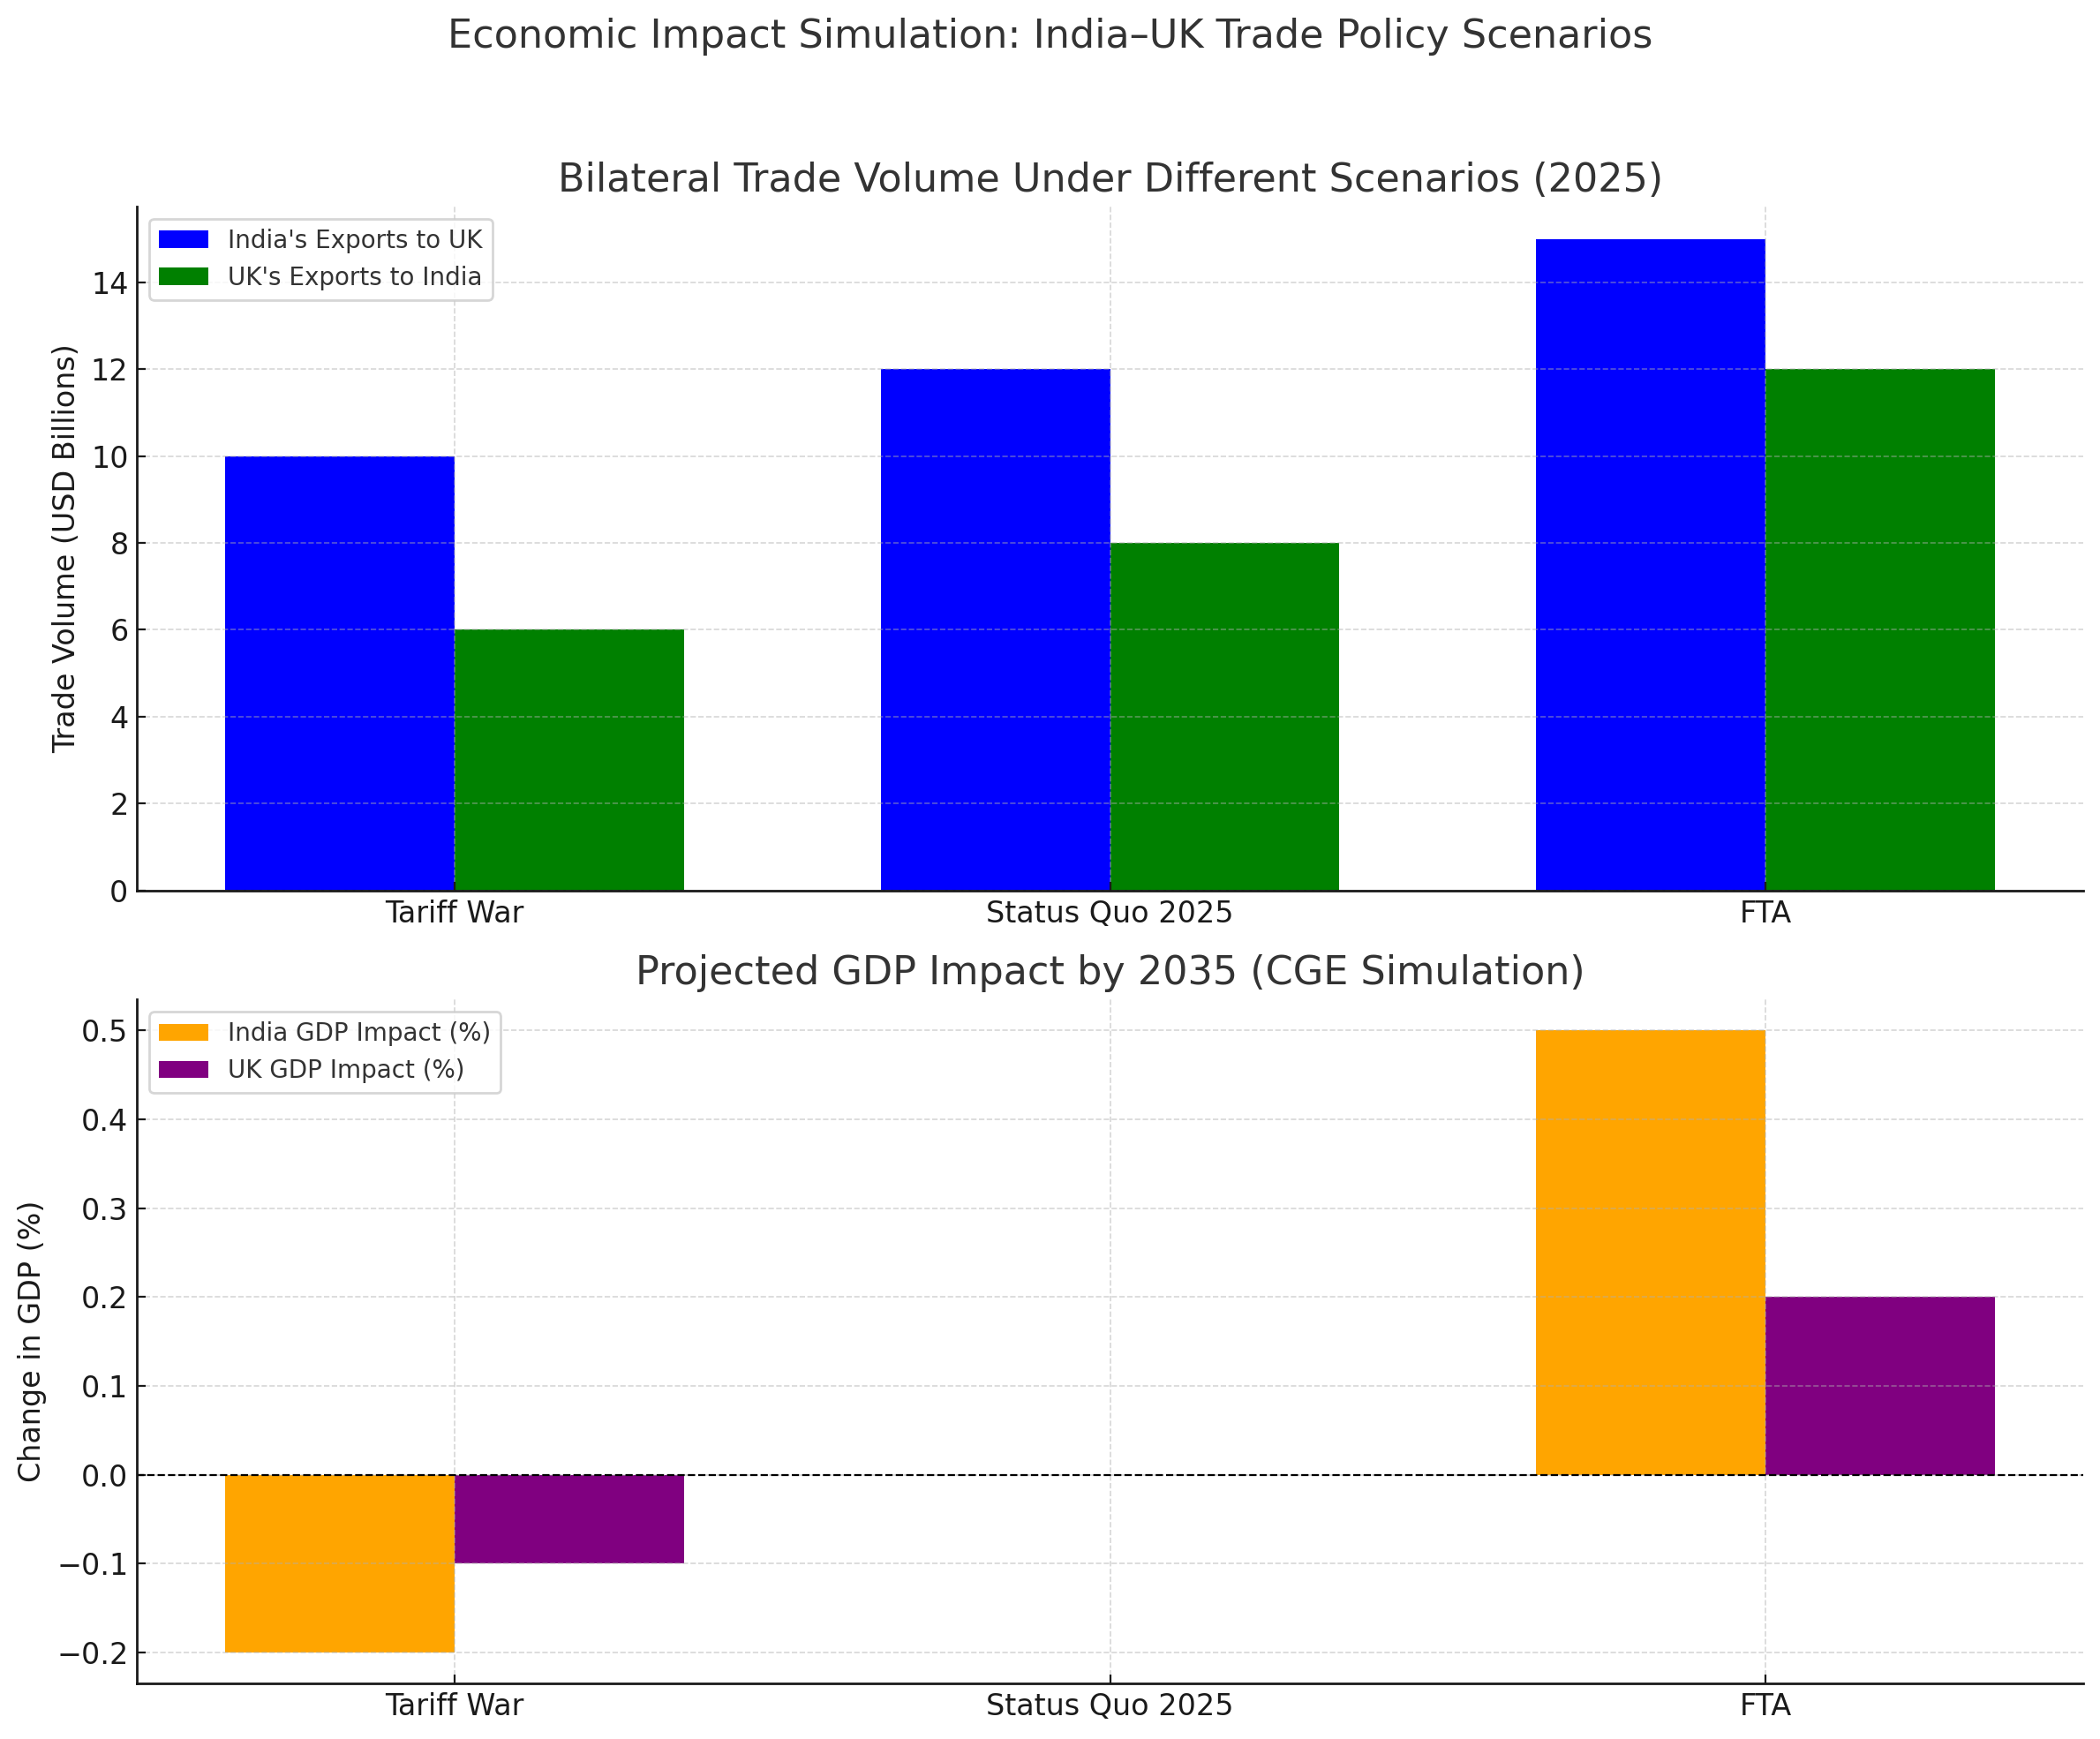
Impact of Tariffs via I-O Models: An input-output model can simulate how tariffs impact prices and output. Tariffs raise the cost of imported inputs, which can then increase production costs in downstream industries. For instance, if the UK imposes a tariff on Indian steel, it raises input costs for UK automakers and construction firms, potentially reducing their output (and increasing prices for consumers). Likewise, India’s tariffs on British machinery make those machines costlier for Indian factories, possibly dampening India’s manufacturing productivity. A CGE (Computable General Equilibrium) model or an I-O based partial equilibrium model was used by the Commonwealth Secretariat to project that an FTA (removing tariffs) would boost UK exports to India by 50% and India’s exports to UK by 12% . The inverse – a tariff escalation – would correspondingly shrink trade and related GDP. For example, if India and the UK imposed, say, 10 percentage-point higher tariffs on each other in a “trade war,” an I-O model would show reduced output in sectors like apparel in India (due to lost UK market share) and whisky in the UK (due to lost India sales), alongside higher prices in both countries. The multiplier effects mean job losses in those sectors and upstream suppliers.
In practical terms, TiVA analysis underscores that the bilateral trade is largely additive to each country’s economy (with limited leakage to third countries through global supply chains so far). Strengthening supply chain links – e.g. UK sourcing more intermediate goods from India (pharmaceutical ingredients, auto parts) and India sourcing more high-tech components from the UK – could create a more balanced partnership and deepen economic integration. The current FTA talks include cooperation on pharmaceutical supply chains and defense co-production, which could raise the foreign value-add shares on both sides.
Tariff War Impacts & Retaliatory Policies
While India and the UK have not engaged in an outright “tariff war” against each other, we can analyze the what-if scenario and small instances of tariff spats to gauge potential impacts:
Affected Industries: A tariff war – where both countries impose higher import duties on each other’s products – would primarily hit the industries that dominate bilateral trade. For the UK, higher Indian tariffs would hurt sectors like automobiles, spirits, machinery, and dairy, where current Indian tariffs are high. UK car exports, already constrained by 100% duty, would virtually halt if duties rose further or if India retaliated by barring certain UK vehicles (benefiting say German or Japanese suppliers instead). The Scotch whisky industry would suffer from lost sales if, say, India placed punitive duties – India is a huge emerging market for whisky (even under 150% duty, UK exported £249 million beverages to India) . On India’s side, higher UK tariffs would hit textiles/garments, engineering goods, refined fuel, and ICT products – key Indian export earners. Indian apparel, for example, faces about 12% UK import tariff today (UK’s MFN rate), but if the UK escalated that or removed India’s GSP benefits as retaliation, Indian clothing would become less competitive against, say, Bangladeshi or Vietnamese products (which have duty-free access to UK). Pharmaceuticals could be another flashpoint: if the UK imposed any tariff or tough quota on generic meds (hypothetically), it could raise NHS costs and hurt Indian pharma firms – though in reality tariffs on medicines are zero under WTO pharma agreement, so a “non-tariff” barrier would be the risk (like stricter regulatory hurdles).
GDP and Employment Effects: A tariff war tends to be lose-lose. By raising import costs and prompting reciprocal action, it reduces overall trade volumes, which can drag down GDP and employment on both sides. For example, in the steel safeguard case of 2022, had India actually imposed $250 million of retaliatory tariffs on UK exports, it would have slightly reduced UK GDP (those exporters lose revenue) and marginally raised India’s import costs (UK goods become pricier). Although $250M is tiny in macro terms, it was strategically targeted (whisky, motorcycles – industries concentrated in certain regions of the UK, like Scotland for whisky). In a bigger trade war scenario (say a 25% across-the-board tariff each way), both economies would take a noticeable hit. India’s exports to UK (around $10bn goods) might drop by double-digit percentages, affecting manufacturing jobs in India. The UK’s overall export volume (and some services exports if India restricted those) would drop, affecting jobs in those sectors. Since India–UK trade is about 2% of UK trade, the macro GDP effect might be small in percentage (perhaps a few tenths of a percent of GDP), but for certain industries and communities the impact would be sharp (e.g. a factory in the Midlands reliant on India as a market might cut jobs). Similarly, for India the macro impact of losing UK market access is small (UK is ~3% of India’s exports ), but specific sectors like India’s apparel factories or IT firms with big UK contracts could see layoffs. The Commonwealth’s study projecting a 25% trade increase from an FTA implies that not getting that increase (or worse, a decrease from a war) means foregoing potential GDP gains. In concrete terms, if an FTA would add, say, £3 billion to UK exports , a tariff war could conversely cost a similar amount in lost exports – impacting thousands of jobs.
Retaliatory Policies: The pattern of retaliation is usually tit-for-tat targeting politically sensitive goods. We saw India line up tariffs on iconic UK exports (Scotch whisky, premium bikes like Triumph) in response to the steel issue . India also did similar with the US in 2019 (targeting almonds and apples in response to US steel tariffs). The UK/EU in past disputes targeted Indian textiles (for labor rights issues) or could target India’s gems or pharma if things escalated. Both countries also have other levers: India might restrict procurement for UK firms or slow customs clearances (NTBs), while the UK could tighten visa issuance or services access – these can be covert retaliation tools. Historically, full retaliation has been rare in India–UK context; instead, they have negotiated solutions. For instance, during the WTO alcohol tariff case, the EU/UK held off retaliation as India proactively reduced duties . In the steel case, India similarly has so far not pulled the trigger, given the broader FTA talks.
Supply Chain and Price Impacts: Tariffs disrupt supply chains by prompting companies to seek alternative sourcing. If the UK became costly to buy from, Indian importers might switch to EU suppliers for machinery or cheese (diversion effect). If India became costly, UK importers might shift to other Asian suppliers for garments or chemicals. This reorganization can cause short-term inefficiencies and higher costs. Consumers ultimately face higher prices. For example, UK consumers would pay more for Indian cotton shirts or basmati rice if tariffs rose (or those products could disappear from shelves if uncompetitive). Indian consumers might pay more for a Jaguar car or for British-made medical devices. Over time, supply chains adjust to minimize the tariff costs – which could ironically reduce the long-term trade connection between India and the UK as they find substitutes.
Tariff War in Wider Context: It’s worth noting that the India–UK trade relationship has flourished in an era without a bilateral FTA, but under WTO MFN rules and some preferences. If a trade war were to break out, it would undermine decades of progress and trust. Both economies are also dealing with other trade tensions (India with the U.S. and China, UK with the EU post-Brexit). A spat between India and UK could spill into multilateral forums – e.g. mutual opposition at WTO negotiations, making consensus harder. It could also have geopolitical implications, given both are strategic partners.
In conclusion, a tariff war would be mutually detrimental – certain export industries would suffer losses, some imports would become costlier, GDP growth would be marginally lower, and precious goodwill would be eroded. This is why both New Delhi and London have thus far exercised restraint and pursued dialogue when trade irritants arise. The trend in recent years is toward lowering trade barriers (via the FTA negotiations) rather than raising them. The impacts of even minor tariff fights (like the steel safeguards) have reinforced the desire on both sides to avoid escalation. As trade analyst Pallavi Rao noted, India and the UK have chosen to engage and deepen ties despite occasional disputes, recognizing that “it’s time to recognise India’s changing place in the world” and that a “stronger, wider, deeper partnership” is preferable to any conflict .
Data Sources & Datasets (2000–2025)
Researchers and policymakers can draw on numerous publicly available databases for India–UK trade and economic data spanning 2000–2025:
UN Comtrade Database: The United Nations Comtrade is a primary source for detailed bilateral merchandise trade data. It provides annual trade values by country and commodity (HS/SITC codes).
IMF Direction of Trade Statistics (DOTS): The IMF DOTS database provides annual and quarterly bilateral trade values for merchandise trade, derived from national accounts. It’s useful for historical time series back to the 1980s.
World Trade Organization (WTO) Stats: The WTO’s databases include the International Trade Statistics and the Integrated Database.
World Bank WITS and WDI: The World Bank’s World Integrated Trade Solution (WITS) is a portal that aggregates data from Comtrade, UNCTAD, and WTO. It can be used to download bilateral trade matrices, tariff rates, and trade indicators.
UNCTADstat: UNCTAD’s statistics portal provides data on trade in goods and services, and FDI. Notably, the UNCTADstat was used in the UK’s factsheet for Indian-reported data.
Reserve Bank of India (RBI) Database: The RBI publishes detailed Balance of Payments data, including exports, imports, invisibles, and partner-country breakups in some cases.
Indian Ministry of Commerce – Export Import Data Bank (EIDB): The Ministry of Commerce & Industry (DGCIS) in India maintains an online database of India’s trade by country and commodity.
UK Office for National Statistics (ONS): The ONS releases data on UK trade in goods and services by partner country, updated quarterly. Datasets like “UK total trade: all countries (seasonally adjusted)” give UK→India and India→UK trade in both goods and services.
OECD TiVA and ICIO: For input-output and value-added analysis, the OECD Trade in Value Added (TiVA) database is key.
Academic and Specialized Datasets: Research institutions often provide curated data. For instance, the World Input-Output Database (WIOD) offers I-O tables from 2000–2014 for global economies including the UK and India, enabling custom trade simulations. The Commonwealth Secretariat and think-tanks like ICRIER or Chatham House have published datasets or figures in their reports (like the Chatham House paper with a table of UK-India trade 1996–2016 ). The TPCI (Trade Promotion Council of India) and others have done analyses including tariff line data.
All the above sources are publicly accessible.