EU-India Trade & Economic Relations (1990–2025): A Comprehensive Analysis
Introduction
India and the European Union (EU) have developed a significant trade partnership since 1990, evolving from relatively modest trade volumes into a major economic relationship by 2025. The EU is now one of India’s top trading partners, accounting for about 12% of India’s goods trade in 2023 . Likewise, India ranks among the EU’s top ten trade partners. This report provides an in-depth analysis of India–EU trade in goods and services, the trajectory of trade balances, sectoral trade patterns, tariff impacts, currency trends, industrial growth, and value-added trade dynamics over 1990–2025. It also reviews key trade agreements, negotiations, and disputes that have influenced the relationship.
Historical Overview of India–EU Trade (1990–2025)
In the early 1990s, India’s trade with the European Community was relatively small, reflecting India’s then-protectionist policies. Following India’s 1991 liberalization reforms, two-way trade began to expand rapidly. In 1990, total goods trade between India and the EU (then 12 member states) was on the order of only $5–6 billion. By 2000, bilateral trade had roughly quadrupled to an estimated $20–25 billion, as India’s economy opened and diversified. Growth accelerated through the 2000s: trade tripled between 2002 and 2018 , reflecting robust growth in both Indian exports (notably textiles, apparel, gems, and IT services) and imports (capital goods, chemicals, etc.).
By the 2010s, India–EU trade had become substantial. Total goods trade rose from about $80 billion in 2011 to $106 billion in 2018 . Despite a dip around 2012–2014 (amid global slowdowns), the overall trend has been upward. In the last decade alone, trade in goods nearly doubled (up ~90%) – from roughly €60 billion in 2013 to €113 billion in 2023 . The chart below illustrates the steep rise in bilateral goods trade over 2000–2023, including the sharp but temporary drop in 2020 due to the COVID-19 pandemic and the strong rebound by 2022 . Both exports and imports reached record levels by 2022–2023, with India importing more from the EU than it exported, leading to a trade deficit in goods in recent years (discussed later).
Trade Balance (Export – Import)

India’s merchandise trade balance with the EU has fluctuated over time. In the 1990s and early 2000s, the balance was relatively small (India ran slight deficits or surpluses under $2 billion). India moved into surplus in the late 2000s, peaking around 2011–2013 when Indian exports to the EU slightly exceeded imports . However, by the late 2010s the balance shifted – India now runs a trade deficit with the EU, which widened significantly by 2022–23. This recent deficit reflects faster growth in India’s imports (e.g. machinery, high-end goods) relative to its exports. The dynamic is illustrated in the next figure: after 2013, the orange and red lines (EU imports from India vs. EU exports to India) crossed, with the shaded area showing India’s goods trade surplus turning into a deficit by 2019 and expanding sharply in 2022.
Overall, India–EU trade has grown exponentially since 1990, driven by India’s economic growth, market-oriented reforms, and the EU’s expanding integration and enlargement (the EU grew from 12 members in 1990 to 28 by 2013, increasing the potential market for India). However, the EU’s share in India’s global trade has declined over time – while the EU was India’s largest trade partner throughout the 1990s–2000s, its share of India’s total exports/imports fell from ~25% in 1990 to about 17% in 2023 , as India diversified trade toward other partners (notably the US and China). Even so, the EU remains a crucial market and source of technology and investment for India, and vice versa India is a growing destination for European exports and investment.
Trade Agreements and Disputes (1990–2025)
Institutional Framework: India–EU economic relations are underpinned by a series of agreements and dialogues. A pivotal step was the 1994 EU–India Cooperation Agreement, which expanded trade and economic cooperation and created a Joint Commission (with a Trade Sub-Commission) . Regular annual summits have been held since 2000, and in 2004 the relationship was upgraded to a Strategic Partnership. These high-level engagements set the agenda for closer trade and investment ties. A Joint Action Plan (2005) further outlined cooperation, and various working groups were formed to tackle trade barriers (standards, agriculture, etc.).
Free Trade Agreement (FTA) Negotiations: In 2007, India and the EU launched negotiations for a broad-based Bilateral Trade and Investment Agreement (BTIA), essentially an FTA. Talks progressed over 2007–2013 with 16 rounds, but proved challenging. Major sticking points included market access for agricultural and dairy products, automobiles, wines and spirits, services and visas, and intellectual property protection. The EU sought a high level of tariff elimination (90%+ of tariff lines) within a decade – consistent with its “Global Europe” FTA strategy – which India, as a developing economy, found difficult . By 2013, negotiations stalled over these differences, including India’s requests for greater EU visas for services professionals and EU demands for deeper tariff cuts (e.g. on cars and alcohol) than India was willing to commit.
After an eight-year hiatus, FTA talks were officially relaunched in May 2021 at the EU-India Leaders’ Meeting . Both sides agreed to resume negotiations toward a “balanced, ambitious, comprehensive and mutually beneficial” agreement . Parallel negotiations on an Investment Protection Agreement and a Geographic Indications pact are also underway . Since 2022, multiple negotiating rounds have been held, and a high-level Trade and Technology Council (TTC) was established in 2023 to deepen cooperation on trade, tech and supply chains . As of 2025, the FTA negotiations are ongoing, aiming to bridge the gaps on tariffs, services, and regulatory standards. If concluded, the India–EU FTA would be one of the world’s largest trade deals, covering two giant markets.
Trade Disputes: Despite generally positive relations, India and the EU have faced several trade disputes:
• Tariffs on Wines and Spirits: The EU challenged India’s high duties on imported wines and spirits in the mid-2000s. India’s state-level taxes resulted in effective tariffs far above its WTO bound rates (150%). The EU filed a WTO dispute in 2007, noting duties as high as 550% on spirits and 264% on wines . To resolve the issue, India eliminated additional customs duties on wine and spirits in 2007 , although it raised the basic duty on wine from 100% to 150% (within WTO bound levels) . This removal of extra duties ended the WTO case and facilitated greater EU alcoholic beverage exports to India, albeit tariffs remain high (150%).
• Seizure of Generic Drugs in Transit: In 2008–09, EU customs authorities (notably in the Netherlands) seized several shipments of generic medicines from India that were in transit to third countries, on the grounds of alleged patent infringement. India (with Brazil) brought a WTO dispute in 2010, arguing that such seizures violated WTO rules on freedom of transit and IP rights . The dispute was settled in 2011 after the EU clarified its regulations – the EU agreed to avoid detaining in-transit generics, effectively ending this irritant.
• Information Technology Tariffs: The EU (joined by Japan and others) lodged a WTO dispute (DS582) in 2019 over India’s import tariffs on certain ICT products (such as mobile phones, telecom equipment). The EU argued India had committed to zero tariffs on these high-tech products in the WTO Information Technology Agreement, but was applying duties up to 20% . In April 2023, a WTO panel ruled in the EU’s favor, finding India’s tariffs breached its bindings . India has appealed the ruling (into the WTO’s currently paralyzed Appellate Body), leaving the issue unresolved. Separately, the EU has launched internal consultations on enforcing compliance, given the importance of ICT trade .
• Other Frictions: India and the EU have sparred over various non-tariff measures. The EU has strict sanitary and phytosanitary (SPS) standards that have occasionally restricted Indian agricultural exports (a notable case was the 2014 EU ban on Indian mangoes due to fruit-fly contamination, lifted in 2015 after improvements in pest control). India has expressed concern about EU regulatory barriers for its pharma and IT services. The EU, for its part, views India’s regulatory environment as relatively restrictive – citing technical barriers to trade, sanitary rules, and preferential treatment for domestic companies in India as challenges . The EU’s carbon border adjustment mechanism (CBAM) for emissions-intensive imports has also raised concerns in India about potential new barriers for Indian exports like steel. Both sides have used trade defense instruments: the EU has anti-dumping duties on certain Indian products (e.g. steel pipes, chemicals), while India has likewise imposed anti-dumping measures on some EU exports. These disputes, while real, have been managed through dialogue at forums like the EU-India High-Level Dialogue on Trade (est. 2021) and consultations at the WTO. Notably, no dispute has escalated into a full “trade war” between India and the EU – instead, most have been resolved or are in legal process, reflecting the generally rules-based approach on both sides.
Trade in Goods: Trends and Sectoral Analysis

Overall Growth: Merchandise trade has expanded markedly in both directions. India’s exports to the EU grew from labor-intensive goods in the 1990s to a more diversified basket today, while India’s imports from the EU have consistently been dominated by machinery and high-value goods. In the last decade (2013–2023), bilateral goods trade increased by ~90% . The EU is currently India’s largest goods trading partner (12.2% of India’s trade in 2023) ahead of China and the US . Conversely, India was the EU’s 9th-largest partner in 2023 (about 2.2% of EU trade) . This asymmetry shows that while the EU market is crucial for India (absorbing about 17.5% of India’s exports) , India accounts for a smaller share of the EU’s global trade (the EU trades far more with China, US, UK, etc.).
Exports vs. Imports: India’s export growth to the EU has been driven by both goods and services (services are covered in the next section). On the goods side, key Indian exports include textiles and apparel, gems and jewelry, pharmaceuticals, steel and other base metals, chemicals, refined petroleum products, and more recently engineering goods and machinery. Indian exports to Europe have moved up the value chain – for example, exports of transport equipment and machinery have grown, with India even exporting autos (small cars) and auto parts to the EU. India’s imports from the EU are dominated by capital goods, industrial supplies, and high-end consumer goods. Major import categories are machinery, electrical equipment, automobiles and auto parts, aircraft, chemicals (including pharmaceuticals), plastics, and medical devices. India also imports significant defense equipment from European suppliers (though not always reflected in civilian trade statistics). In agricultural trade, India typically runs a surplus (exporting products like rice, seafood, and spices to Europe, while importing European wines, spirits, and specialty foods in smaller quantities).
Trade Balance: As noted, India’s merchandise trade balance with the EU shifted from near-balance or slight surplus in the early 2010s to a deficit in recent years. The deficit reached €20.3 billion in 2022 (as India’s imports from the EU jumped post-pandemic) . In 2023 the deficit was about €16.7 billion . This reflects India’s high demand for European capital goods and intermediates for its development needs. However, the deficit is manageable (the EU accounts for roughly 2% of India’s GDP in imports). Both sides view the expansion of trade positively as it indicates growing engagement, though India continues to push for more market access for its exports to narrow the gap.
Sectoral Composition: Manufactured goods dominate India–EU goods trade, making up over 85% of the trade value on both sides. In 2023, manufactured products (SITC sections 5–8) comprised about 96% of EU exports to India and 90% of EU imports from India by value (with primary commodities and “other” accounting for the rest). The EU’s exports are heavily concentrated in machinery and transport equipment, which alone accounted for about 50% of EU goods exports to India in 2023 . Next were chemicals (including pharmaceuticals) at ~15%, and manufactured goods classified chiefly by material (e.g. iron and steel products, other intermediates) another ~15% . In contrast, the EU’s imports from India are more varied across several sectors: the largest categories in 2023 were manufactured goods/materials (~24% share, e.g. refined petroleum, basic metals, minerals) and machinery & transport equipment (~24%, including automobiles, engines, etc. produced in India) . Not far behind were chemicals (~18%, largely pharmaceuticals) and miscellaneous manufactured articles (~13.5%, which include textiles, clothing, leather goods, gems & jewelry, etc.) . Agricultural products play a smaller role: they made up only ~5% of EU imports from India (notably rice, fish/seafood, and plant products) and an even smaller fraction of EU exports to India (India imports some European alcoholic beverages, dairy products, and fruits).
Key Industries: On India’s side, industries that have benefited from EU trade include: Textiles and Apparel (the EU is a top market for Indian garments; removal of EU import quotas in 2005 boosted these exports), Pharmaceuticals (Indian generic drug companies export extensively to the EU, though subject to regulatory approval), Information Technology hardware (e.g. electronics assembly, though EU’s share here is smaller than Asia/US), Petroleum refining (India exports refined fuels to EU when arbitrage favors), Steel and Aluminum (India exports metal products; the EU has imposed safeguards/AD measures at times due to surges). On the EU side, major industries trading with India are Machinery and Industrial Equipment (from turbines to factory machinery), Automotive (European cars and parts to India, albeit constrained by tariffs; some Indian auto parts exported back), Aerospace (Airbus has sold aircraft to Indian airlines; parts sourcing in India is growing), Chemical industry (India is a big market for EU chemicals and also a supplier of generics and specialty chemicals), and Luxury and Consumer Goods (from European fashion to automobiles and wines for India’s growing middle class). In recent years, renewable energy equipment (e.g. wind turbine parts, solar panels components) has also become part of the trade as India expands green energy and Europe sources some components from India.
Trade in Services

Trade in services between India and the EU has grown remarkably since the 1990s, reflecting India’s emergence as a global services exporter and the EU’s strength in services as well. In the 1990s, services trade was limited (no precise data for 1990, but likely only a few billion dollars, mainly travel and transportation). By the 2000s, India’s IT and IT-enabled services (ITES) boom led to rapidly rising exports of software, back-office, and professional services to Europe. Conversely, European companies began providing more financial, engineering, and education services in the Indian market.
In recent years, services have become a significant component of India–EU economic relations. In 2023, bilateral services trade reached nearly €60 billion, almost double its 2020 level . The EU imports substantial services from India – in fact, India runs a services trade surplus with the EU. For example, in 2021 India–EU services trade was around €40 billion , with India exporting ~€20+ billion in services to the EU. By 2023, India’s services exports to the EU had soared to roughly €35–36 billion, while India’s imports of services from the EU were about €24–25 billion, leaving India with a surplus of around €10+ billion in services. The chart below shows the trend for 2021–2023: India’s services exports to the EU (EU imports, teal bars) grew from ~€22 billion in 2021 to ~€35 billion in 2023, while EU services exports to India (orange bars) grew from ~€21 billion to ~€27 billion. India’s surplus in services (yellow) expanded over this period . This rapid growth, especially from 2020 to 2023, was driven by increased demand for digital services during the pandemic and post-pandemic recovery.
Composition of Services Trade: The IT and software services sector is the engine of India’s services exports to Europe. European firms outsource software development, IT consulting, business process outsourcing (BPO), and R&D services to Indian providers (e.g. TCS, Infosys, Wipro have a strong presence in Europe). A significant share – roughly one-third – of EU–India services trade is in digital services (computer and information services) . Other major Indian services exports include business and professional services (such as engineering, consulting, R&D, legal and accounting services), travel and tourism (India earns from European tourists, though this was hit in 2020), and transportation services (shipping, port services for the goods trade). On the import side, India imports substantial financial services (banking, insurance) from European institutions, royalties/licensing (related to technology and intellectual property from Europe), as well as education and travel services (Indian students studying in Europe, tourism to Europe, etc.). The EU is also a provider of transport and logistics services for India’s trade.
Notably, India is not yet a major market for EU’s financial services exports due to regulatory barriers – e.g. India has not given “data secure nation” status to the EU in the past, complicating cross-border data flows for financial/BPO services . Nonetheless, European banks and companies are active in India’s market under local subsidiaries. Conversely, Indian IT companies operate in the EU through subsidiaries to serve local clients. Mode 4 services trade (movement of natural persons) is an area of contention: India has a strong interest in easier visa/access for its professionals in Europe as part of any FTA, while the EU has been cautious on migration issues. These topics are part of the ongoing negotiations.
Tariffs and Market Access Impacts

A fundamental aspect of India–EU trade has been the difference in tariff regimes. India historically had very high tariffs on goods, which have gradually been reduced, while the EU has long maintained low tariffs on most goods (with some exceptions in agriculture).
India’s Tariffs: In 1990, India was a highly protected economy – average import tariffs exceeded 100%. In the early 1990s, India’s applied tariff rates were among the highest in the world, often over 125% on average for many products. Through the 1990s reforms and WTO commitments, India slashed its tariffs dramatically. By 1999, India’s average tariff had fallen to 79% . This was further cut to around 17% by 2005 . In other words, within a decade India moved from prohibitive tariffs toward moderate levels. Since 2005, tariff reductions have continued at a slower pace – in the 2010s India’s average applied tariff ranged from ~13% to 15%. As of the mid-2020s, India’s weighted average applied tariff is roughly 10–15% (with higher rates on certain sensitive sectors). The steep decline in India’s tariffs from 1990 to 2005 is illustrated in the figure below . This liberalization was a key factor in the surge of India–EU trade, as it opened the Indian market to European goods. However, India still maintains higher tariffs than developed countries: many industrial goods face 7.5–10% duties, autos 60–100%, textiles ~10%, and some agricultural items even higher (India’s bound tariffs on most agriculture are 100% or more, though applied rates are often lower).
EU’s Tariffs: The EU, by contrast, has relatively low tariffs. Its average applied MFN tariff is about ~5% for non-agricultural products and around 8–12% for agricultural products. On industrial goods, the EU’s tariffs are mostly in the 0–5% range (zero on many information technology products, low single digits on chemicals, metals, etc.). The EU’s average tariff is about 2–3% when weighting trade – far below India’s. This asymmetry means India’s exporters generally face low border taxes entering Europe, whereas European exporters to India often face much higher duties. For example, European cars exported to India incur 60–100% tariffs (India’s tariff on fully built cars is 100% for petrol/diesel vehicles), wines and spirits face 150% basic duty, etc., making these products expensive in India . Reducing these high Indian tariffs is a major EU objective in the FTA negotiations. From India’s perspective, however, many of these tariffs protect millions of jobs in industries like autos and farming – hence India has been reluctant to eliminate them without safeguards.
Tariff Impacts on Trade: High tariffs have undoubtedly limited the growth of certain trade flows. For instance, automotive trade is far below potential – European automakers export only niche luxury models to India (few in number) due to the 100% duty, and India likewise exports few cars to Europe (not due to tariffs, which are low, but due to EU safety/environment standards). In contrast, pharmaceuticals trade flourished after India and EU reduced duties (EU tariffs on medicines are zero, and India’s pharma tariffs are modest), allowing India to become a major generic drug supplier to Europe. Textiles and clothing saw Indian exports to EU rise after the end of EU quotas and as tariffs (which were around 10–12%) were not prohibitive. European textile exporters, however, still face around 10% tariffs in India. Agriculture: Both sides maintain higher barriers – the EU Common Agricultural Policy results in tariffs (and subsidies) that restrict Indian farm exports (like dairy, where EU tariffs and health standards block Indian dairy products). Meanwhile, India’s high tariffs (50–100% on many foods) and occasional import restrictions limit imports of European agricultural goods. These tariff walls have kept agricultural trade small.
“Tariff Wars”: While India and the EU haven’t engaged in a direct trade war, there have been tit-for-tat tariff moves in a broader context. In 2018, after the US raised steel/aluminum tariffs, the EU imposed retaliatory tariffs on the US and also sought alternative suppliers. India, not directly involved in that dispute with the EU, nonetheless raised some import duties in its 2018 and 2019 budgets on electronics and other goods as part of a policy shift toward protecting domestic industry (under the “Make in India” initiative). European businesses expressed concerns that India’s average tariff actually crept up slightly in late 2010s after decades of decline. For example, India increased tariffs on electronics and telecom equipment to 20% by 2018, affecting European exporters like Nokia (network equipment) and Siemens. This contributed to the ICT dispute mentioned earlier. The EU has not dramatically raised tariffs on Indian goods (except through anti-dumping duties in specific cases), but it withdrew India’s GSP (Generalized System of Preferences) benefits for certain products in 2014 when India became an upper-middle income country. The end of GSP meant some Indian exports (e.g. textiles, gems) faced the EU’s normal MFN tariffs of a few percent instead of zero – a marginal impact, but notable for those sectors.
Industrial Growth and Supply Chain Integration

Industrial Growth: The trade relationship has both driven and reflected industrial growth in India and the EU. For India, increased access to the large EU market has spurred growth in export-oriented industries. Sectors like textiles & apparel saw significant investment and job creation in the 2000s to meet EU demand. The IT/BPO industry in India, while primarily US-focused initially, also grew by catering to European clients – contributing to a services-led growth model. Pharmaceuticals is another sector where India’s industry scaled up (India is often called “pharmacy of the world”) and the EU became a key customer for generic drugs. On the import side, India’s purchase of European capital goods (machinery, power equipment, etc.) has aided its infrastructure and manufacturing growth. For example, European machine tools and electrical equipment have equipped Indian factories, and imports of commercial aircraft from Airbus have supported India’s aviation boom. Thus, trade has played a role in India’s GDP growth and industrialization, providing both markets for output and inputs for production.
In the EU, trade with India is too small to significantly impact the whole EU economy (India is ~2% of EU trade), but certain industries have benefited from India’s rise. German and Italian machinery manufacturers, for instance, gained a growing market in India for industrial machines. Automotive companies (like Volkswagen, BMW) see India as a major future market (though current sales are limited by tariffs, many have invested in local assembly). Chemical companies (BASF, Bayer, etc.) have seen export growth to India’s expanding industrial and agricultural sectors. The EU’s services firms (consulting, finance) have also found opportunities as India’s economy modernizes (though often they serve via local subsidiaries due to India’s regulations). Overall, while India’s share in EU trade is modest, it has contributed to incremental growth in specific export sectors and provides diversification (especially as EU exports to India grew even when some other markets were stagnant).

Supply Chain and Value-Added Trade: A notable feature of India–EU trade is that it has not been as deeply integrated into global supply chains as, say, EU–China trade. Much of the trade is end-products or intermediate goods with relatively high domestic value content on each side. According to OECD Trade in Value Added (TiVA) data, around 70–75% of the value in India’s gross exports to the EU is domestic value-added, implying about 25–30% is imported inputs (this foreign content often comes from Asian supply chains, e.g. electronic components from East Asia that are assembled in India and then exported to Europe). For EU exports to India, the domestic value content is even higher (over 85%), since the EU’s exports are often high-tech goods produced largely within Europe) . This indicates that India–EU trade is not heavily characterized by back-and-forth assembly processes; instead, it is more of a traditional exchange of finished or semi-finished goods. In contrast, something like EU–China trade involves a lot of supply chain trade (Chinese final assembly of European-designed goods, etc.).
That said, there are emerging supply chain linkages. Automotive and engineering: European auto firms source certain auto components from India (e.g. Bharat Forge in India supplies crankshafts to European carmakers). Pharmaceuticals: European pharma companies source bulk drugs and formulations from India, integrating into their supply chains for generics. Renewables: European wind turbine manufacturers source some towers/blades from India. Also, European firms in India (via FDI) create intra-firm trade: for example, Siemens India may import components from Germany and export finished turbines to other markets. The OECD TiVA 2021 data indicates India’s integration into global value chains (GVCs) has been increasing gradually, but it remains lower than many Asian peers. India’s GVC participation rate (the share of exports that are part of multi-stage trade) is estimated around 38%, compared to over 50% for countries like Vietnam or Malaysia . Strengthening supply chain integration with the EU – for instance, encouraging European companies to use India as a manufacturing base for exports – is a goal for both sides (the EU’s new strategy sees India as a potential alternative supply hub for certain products in the Indo-Pacific). Initiatives under the Trade and Technology Council aim to align standards and infrastructure to facilitate this.
Value-Added Trade Balance: When considering trade in value-added terms (stripping out foreign inputs), India’s trade balance with the EU is a bit different. India’s deficit in goods shrinks somewhat on a value-added basis, because a portion of India’s imports from the EU consists of inputs that help produce India’s own exports (some of which go back to the EU or elsewhere). For example, high-end machinery imported from the EU can enable Indian production that generates value added domestically. Conversely, some of India’s exports, like refined petroleum, have a high import content (crude oil). The OECD TiVA data show that after accounting for these, the bilateral imbalance is smaller. Moreover, India’s services surplus adds positively – in value-added terms, India likely runs an overall current account surplus with the EU (services and remittances offsetting the merchandise deficit).
Industrial and Supply Chain Cooperation: With growing strategic alignment, both parties are keen to develop resilient supply chains together. The COVID-19 pandemic and geopolitical shifts (e.g. EU “China+1” strategy) have led the EU and India to discuss diversifying supply chains for critical sectors like pharmaceutical APIs, rare earths, semiconductors, and batteries. India, with its large market and skill base, is seen as a promising manufacturing hub if issues (infrastructure, regulatory) are addressed. The EU–India Connectivity partnership (2021) and initiatives on clean energy also envision joint development of industries (for example, collaborating on solar panel production, green hydrogen etc., which would create new trade flows).
The existing data already show positive trends: by 2020, over €8.3 billion of EU’s exports to India (about 20%) were intermediate inputs for Indian production, and about €5.9 billion of India’s exports to the EU (15%) were intermediate goods for EU industries. These figures underscore a growing production interdependence that is expected to increase.
Conclusion
Over 1990–2025, India–EU trade relations have transformed dramatically – from a relatively minor exchange to a comprehensive economic partnership covering goods, services, investment, and technology. Bilateral trade in goods surged from roughly $5 billion to over $130 billion, while services trade rose to nearly $60 billion. The relationship encompasses all major sectors of the economy: agriculture, manufacturing (textiles, chemicals, machinery, etc.), energy, and a wide array of services. Tariff reductions and India’s liberalization unlocked trade growth, even as ongoing negotiations seek to resolve the remaining high tariffs and barriers. India has emerged as a key trade and investment destination for Europe, and the EU is critical for India’s export-led development and integration into global value chains.
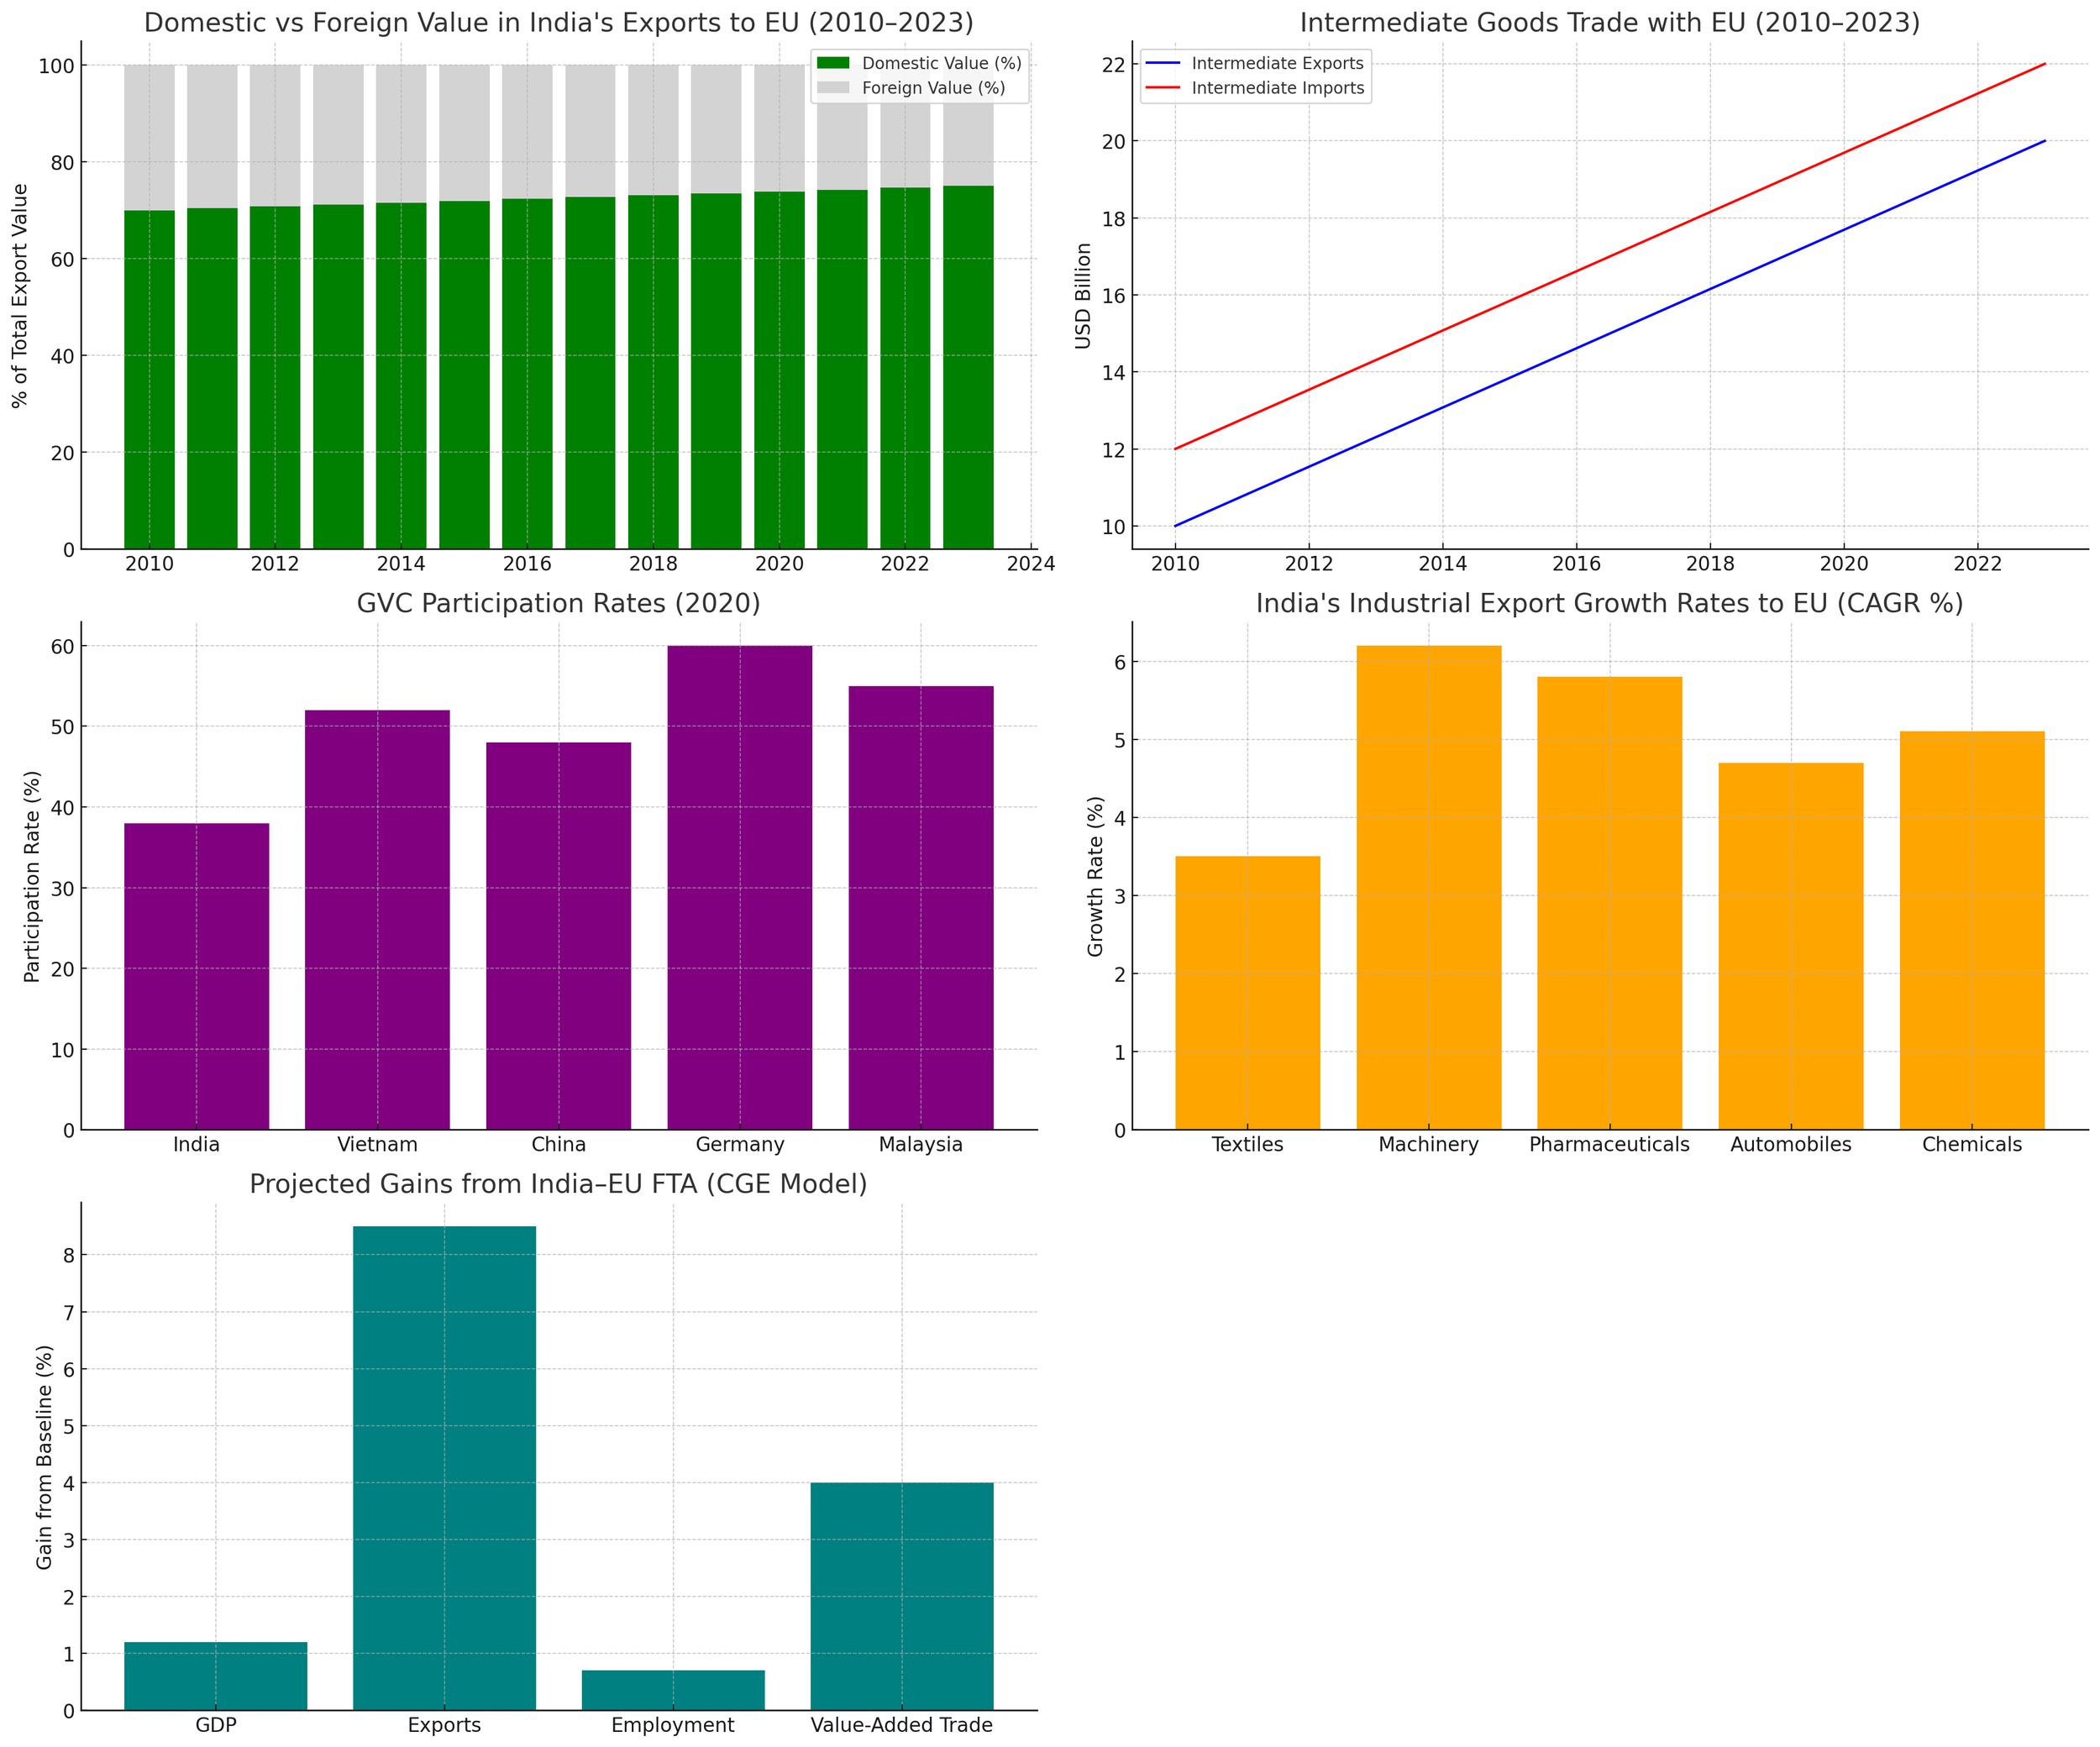
Challenges certainly remain – from balancing trade deficits to resolving disputes and aligning regulations – but both sides appear committed to deeper ties. The pursuit of an ambitious FTA, alongside initiatives like the Trade & Technology Council, suggests a recognition that closer economic integration can yield substantial benefits. According to analyses using CGE models (such as those from the GTAP framework), a successful India–EU FTA could significantly boost GDP and welfare for both: Indian exports to the EU are projected to more than double, and EU exports to India could rise by ~50–60% in the long run . It would also positively influence value-added trade, allowing each to specialize more efficiently.
In summary, the India–EU economic relationship from 1990 to 2025 is one of growth, diversification, and gradually liberalizing trade, punctuated by negotiations and occasional disputes, but trending toward greater partnership. With complementary strengths – India as a growing market and services/industrial base, and the EU as a technology and capital-rich economic bloc – their trade relations are poised to become even more significant in the coming decades, potentially rivaling the EU’s trade with other large partners. The data and trends reviewed in this report underscore that while much has been achieved in 35 years, the full potential of India–EU trade is yet to be realized, awaiting the resolution of remaining barriers and the conclusion of a comprehensive trade agreement.